Chemosensors is an R Software tool that allows for the design of synthetic experiments  with so-called virtual gas sensor arrays. The package was developed by Andrey Ziyatdinov and Alexandre Perera.
This R package was a product of the Neurochem project, an 7FP Bio-ICT project focused on Bioengineering and bioinspired computing.
The R package and tutorial can be found here.
Installation from CRAN (recommended)
The command in R to install the package:
install.packages("chemosensors")
The stable version of chemosensors package from the CRAN repository will be installed
Installation from R-forge
Chemosensors package can be installed as a regular R package from the R-Forge repository. The command to type in R:
install.packages("chemosensors", dep=TRUE, repos="http://r-forge.r-project.org")
That will install the latest development version with all dependencies.
Please let us know if you have any problems related to installation or running the software.
Documentation
Help pages in html format are available on http://chemosensors.r-forge.r-project.org/html/. Thanks to devtools and staticdocs.
Examples
You might prefer to start with demos of the package. To see the list of available demos type in R:
demo(package="chemosensors")
Basic commands to generate synthetic data from a virtual sensor array could be:
# concentration matrix of 3 gas classes: A, C and AC
conc <- matrix(0, 300, 3)
conc[1:100, 1] <- 0.05 # A
conc[101:200, 3] <- 1 # C
conc[201:300, 1] <- 0.05 # AC
conc[201:300, 3] <- 1 # AC

conc <- conc[sample(1:nrow(conc)  ), ]

# sensor array of 5 sensors with parametrized noise levels
sa <- SensorArray(num=1:5, csd=0.1, ssd=0.1, dsd=0.1)

# get information about the array
print(sa)
plot(sa)

# generate the data
sdata <- predict(sa, conc)

# plot the data
plot(sa, "prediction", conc=conc)
Animation demo
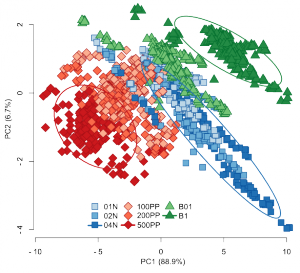
This animation presents a simulation of synthetic data with different noise parameters. The synthetic data (top of the graphics) is visually compared with the reference UNIMAN data (bottom of the graphics) by plotting PCA scores.
Objective of the simulation is to reproduce the reference dataset by playing with combinations of the parameters (barplot on the graphics). The virtual sensor array is composed of the same number of sensors (17) as the UNIMAN array. The concentration profile of 200 samples contains eight gas classes (legend of the graphics).
Three noise parameters represent concentration noise (csd), sensor noise (ssd) and drift (dsd).
Further information at:
- Andrey Ziyatdinov, Alexandre Perera, Synthetic benchmarks for machine olfaction: Classification, segmentation and sensor damage Data in Brief,Volume 3, 2015, Pages 126-130, ISSN 2352-3409, https://doi.org/10.1016/j.dib.2015.02.011.
http://www.sciencedirect.com/science/article/pii/S2352340915000220
The three synthetic datasets mentioned in the paper can be downloaded (1Gb approx) following this link.
Contacts
Alexandre Perera
Email: alexandre.perera [at] upc.edu
Andrey Ziyatdinov
Email: andrey.ziyatdinov [at] upc.edu
Address:
Universitat Politècnica de Catalunya, dept. ESAII
c/ Pau Gargallo 5, 08028 Barcelona, Spain
Tel.: +34 93 407 07 73
Acknowledgment
This work was funded from the European Community’s Seventh Framework Programme (FP7/2007-2013) under grant agreement no. 216916: Biologically inspired computation for chemical sensing (NEUROChem), the Ramon y Cajal program from the Spanish Ministerio de Educacion y Ciencia and TEC2010-20886-C02-02. CIBER-BBN is an initiative of the Spanish ISCIII.
