---
title: "Computing Homology"
---
Sequence comparison algorithms are a key piece in the family of tools used in
bioinformatics. These algorithms look for protein or DNA sequences that resemble
a sample sequence you already know. This laboratory introduces the **BLAST** set
of tools and multiple alignment.
By the end of this laboratory you will be able to:
- explain sequence homology, orthology/paralogy, and how e-values quantify similarity
- choose the right BLAST flavour (blastp, tblastn, blastx, tblastx, blastn) for a task
- run protein and DNA similarity searches at NCBI and EBI and interpret the results
- read a BLAST alignment (identities, positives, gaps, masked regions)
- apply homology search to a real problem: characterising the SARS-CoV-2 genome
Significant similarity between two or more sequences suggests they share a common
ancestor, similar structure, and biological function. This is surprisingly
useful: it can reveal the role of a sequence of unknown function through a similar
sequence of known function, possibly even from a different organism.
```{r}
#| label: homology-setup
#| include: false
source("R/setup.R")
```
::: {.callout-note appearance="minimal" title="Lab at a glance"}
**Goal:** understand sequence homology and run similarity searches and alignments.
**Prerequisites:** [Introduction to R](intro-r.qmd); [Searching NCBI & Ensembl](search-ncbi.qmd).
**Time:** ~2.5 h. **Packages:** `Biostrings`, `pwalign`, `ape` (and `rentrez`/`rBLAST` for the
optional programmatic search). **Deliverable:** a lab report.
:::
## Homology {#sec-homology}
Two sequences are **homologous** when they share a common ancestor and thus show
clear similarities. The concept of homology is central to comparative biology and
fundamental to understanding sequence function.
When sequences are homologous, they are also *conserved*. Conservation refers to
a high degree of similarity in protein or orthologous[^ortho-note] DNA sequences
and protein structures. A highly conserved region or protein is usually related
to an important function: a mutation in a highly conserved region would likely
lead to a non-viable organism, or one strongly disfavoured by natural selection.
[^ortho-note]: Homologous sequences are **orthologous** if they were separated by
a speciation event: when a species diverges into two, the divergent copies of a
single gene are orthologous. They are **paralogous** if separated by a gene
duplication event: if a gene is duplicated to occupy two positions in the same
genome, the two copies are paralogous.
From a practical point of view, two sequences can be considered homologous if
25% of amino acids are identical (proteins) or 70% of nucleotides are identical
(DNA) — though this holds only for sufficiently long sequences (>100 residues).
Homology algorithms report the **e-value** (the odds that the similarity is due
to chance), the length of the similar segments, and the number of
insertions/deletions. A reasonable e-value falls below $10^{-4}$; a useful rule of
thumb for interpretation:
- $E < 10^{-100}$: identical sequence (same gene/protein and organism)
- $10^{-100} < E < 10^{-50}$: almost identical sequence
- $10^{-50} < E < 10^{-10}$: closely related sequence
- $10^{-5} < E < 1$: could be a true homologue
- $E > 1$: most likely not related
## Alignment types {#sec-alignment-types}
Over the past decades, computing sequence similarity has improved dramatically.
Where similarity was once found by visual inspection, a query is now compared
automatically against databases of millions of sequences.
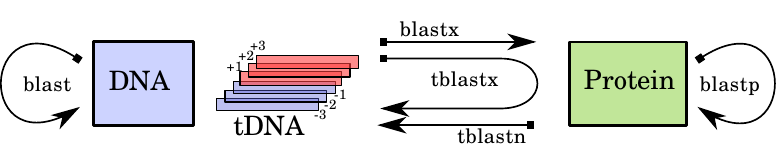
The most famous algorithm in bioinformatics is **BLAST** — *Basic Local Alignment
Search Tool*. Several flavours target different search types:
1. **Nucleotide BLAST** — search a nucleotide database with a nucleotide query (blastn, megablast, discontiguous megablast).
2. **Protein BLAST** — search a protein database with a protein query (blastp, psi-blast, phi-blast).
3. **blastx** — search a protein database with a translated nucleotide query.
4. **tblastn** — search a translated nucleotide database with a protein query.
5. **tblastx** — search a translated nucleotide database with a translated nucleotide query.
These methods are summarised in @fig-blast-fam.
{#fig-blast-fam width=80% fig-alt="Scheme of the main BLAST search methods."}
## Working with protein sequences {#sec-protein-sequences}
This section applies when you have a protein sequence and want to find similar
proteins, or DNA that could code for similar proteins. Following @fig-blast-fam,
two methods are available: **blastp** (protein query against a protein database)
and **tblastn** (protein query against a nucleotide database).
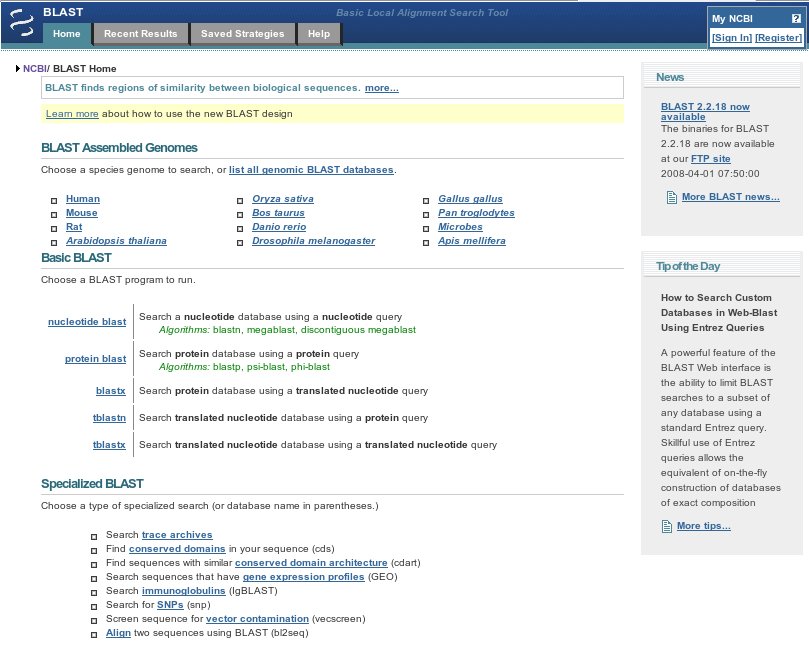
The same BLAST query on different servers can yield different results, because
each interface may work with different databases or versions. We use the two main
BLAST interfaces (NCBI and EMBnet) and stick to NCBI for the following sections.
{#fig-ncbiblast width=95% fig-alt="NCBI BLAST entry site."}
### BLASTP at NCBI {#sec-blastp-ncbi}
We will answer whether there are any proteins similar to the human Low-density
lipoprotein receptor precursor, found in the SWISS-PROT protein database.
::: {.callout-tip title="✅ Exercise 5.1 — BLASTP at NCBI"}
1. Find the BLAST entry point at NCBI (<https://blast.ncbi.nlm.nih.gov/>).
2. Look for the amino-acid sequence of the LDL receptor (precursor) for *Homo
sapiens* — from the gene search as **LDLR**.
3. Insert the amino-acid sequence or the accession number into the *blastp* suite
(it accepts a sequence or a SWISS-PROT accession `P0XXXX`). Run a BLASTP search
with default parameters.
4. Which databases did the algorithm cover?
5. Return to the *blastp* form and select SWISS-PROT in the database selector. List
and explain the first 5 hits.
6. Which is the closest protein? What percentage of coincidence do the two share?
7. Open the Distance Tree view and describe the result.
:::
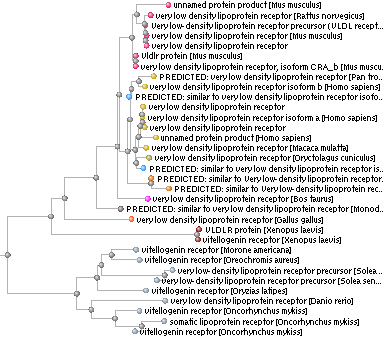{#fig-blast-tree width=80% fig-alt="NCBI BLAST: partial results in tree form."}
The graphic display with bars shows which parts of the query sequence match the
found protein sequence. Each bar represents a similar region, and its colour
indicates match quality — from black (worst) to red (best). Clicking a bar takes
you to the corresponding alignment. The hit list below shows the sequence
accession, name, and description; each entry links to its database record.
{#fig-align width=100% fig-alt="NCBI BLAST: alignment section excerpt."}
The alignment section (@fig-align) shows your query sequence (top) and the found
sequence (bottom). In the middle row, an amino-acid letter indicates a match, a
`+` indicates similar residues, and a space indicates a mismatch. The numbers on
each side give the residue coordinates of the matching region. Regions marked
`X` usually contain many repeats and are masked by BLAST so they don't interfere
with the search.
::: {.callout-tip title="✅ Exercise 5.2 — Alignments"}
1. Why would regions with repeats be masked by BLAST?
2. What are Conserved Domains (CD) in proteins? What is their effect if included
in BLAST searches?
:::
::: {.content-hidden when-format="pdf" unless-profile="solutions"}
::: {.callout-tip collapse="true" title="Solution 5.2"}
- Low-complexity/repeat regions match *non-homologously* by chance (they recur
everywhere), inflating e-values, so masking them stops spurious hits.
- Conserved domains are evolutionarily conserved functional/structural units of a
protein; displaying them (CD-search) flags the biological role of each hit.
:::
:::
### TBLASTN at NCBI {#sec-tblastn-ncbi}
Here we seek DNA nucleotide sequences starting from a protein sequence, using
**tblastn**. This takes a protein query and compares it against an NCBI nucleotide
database translated in all six reading frames.
::: {.callout-tip title="✅ Exercise 5.3 — TBLASTN"}
1. Run a *tblastn* query with the same protein sequence you used for BLASTP.
2. Comment on the type of the first results and the differences from the BLASTP
results.
:::
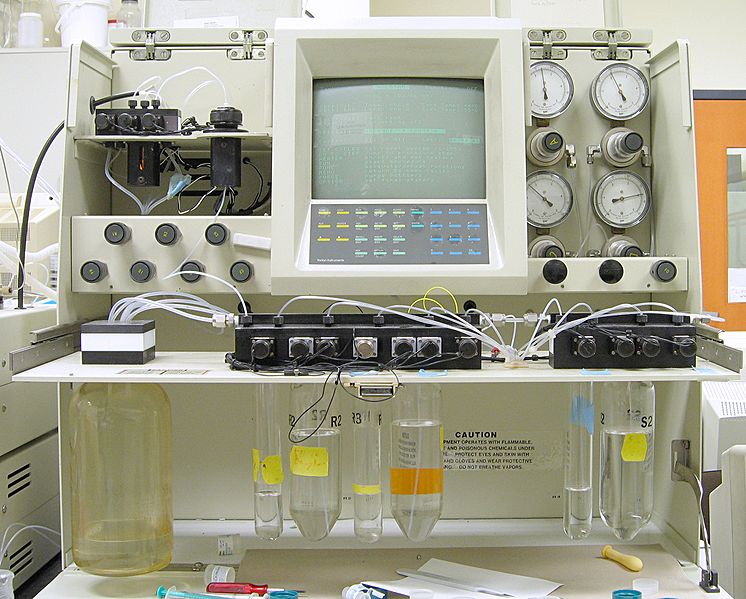{#fig-protein-sequencer width=100% fig-alt="A Beckman-Coulter Porton LF3000G protein sequencer."}
### BLASTP at EBI {#sec-blastp-ebi}
Protein sequencing determines the amino-acid sequence of a protein, helping to
understand its structure and function. Imagine you work in a lab on bio-inspired
technologies for computer displays, trying to identify a novel insect protein
that would enable organic displays with high electroluminescence at very low
power. You suspect you have isolated it — Problem Sequence 1 below.
::: {.callout-tip title="✅ Exercise 5.4 — BLASTP at EBI"}
1. Connect to the EBI Sequence Similarity Searching website
(<https://www.ebi.ac.uk/jdispatcher/sss>).
2. Choose PSI-BLAST (Protein Database Query) and paste Problem Sequence 1.
3. Explore the Results sections: Summary, Tool Output, Visual Output, Functional
Predictions.
4. Can you hypothesise a function for this protein sequence? Did you find the
protein you were looking for?
5. If you find the protein of Sequence 2 in a patient, what would you suggest?
6. If sequences A and B are both homologous to your query C, can you conclude that
A is homologous to B?
:::
```text
>sp|Problem Sequence 1
CGGAGKVEYITAPFYPLEDTTAGEQLHKAMKRYALVPGTIAFDAHIEVYQGFQAEYFEMS
VRLAEAMKRYGLNTNHRIVVCSENSLQFFMPVLGALFIGVAVAPANDIYIERELLNSMNI
SQPTVVFVSEEGWQKILNVQKKLPIIQKIIIMDSKTDYQGFQSMYTFVTSHLPPGFNEYD
FVPESFDRDKTIALISNSSGSTGLPKGVALPHRTACVRFSHARDPIFGNQIIPDTAILSV
VPFHHGFGMFTTLGYLICGFRVVLMYRFEEELFLRSLQDYKIQSALLVPTLFSFFAKSTL
IDKYDLSNLHEIASGGAPISKEVGEAVAKRFHLPGIRQGYGLTETTSAILITPEGDDKPG
AVGKVVPFFEAKVVDLDTGKTLGVNQRGELCVRGPMIMSLYVNNPEATNALIDKDGWLHS
AVGKVVPFFEAKVVDLDTGKGLGPKGVALPHRTACVRFSHARDPIFGNQAVAKRFHLPLE
GDIAYWDEDEHFFIVDLLKSLIKYKGYQVAAAALESILLQHPNIFDAGVAGLPDDDAGEL
PAAVVVLEHGKTMTEKEIV

>sp|Problem Sequence 2
MFVFLVLLPLVSSQCVNLTTRTQLPPAYTNSFTRGVYYPDKVFRSSVLHSTQDLFLPFFSNVTWFHAIHV
SGTNGTKRFDNPVLPFNDGVYFASTEKSNIIRGWIFGTTLDSKTQSLLIVNNATNVVIKVCEFQFCNDPF
LGVYYHKNNKSWMESEFRVYSSANNCTFEYVSQPFLMDLEGKQGNFKNLREFVFKNIDGYFKIYSKHTPI
NLVRDLPQGFSALEPLVDLPIGINITRNQFNSAIGRSYLTPGDSSSGWTAGAAAYPIHKELERTFLLKYN
ENGTITDAVDCALDPLSETKCTLKSFTVEKGIYQTSNFRVQPTESIVRFPNITNLCPFGEVFNATRFASV
YAWNRKRISNCVADYSVLYNSASFSTFKCYGVSPTKLNDLCFTNVYADSFVIRGDEVRQIAPGQTGKIAD
YNYKLPDDFTGCVIAWNSNNEEEEEEENYNYLYRLFRKSNLKPFERDISTEIYQAGSTPCNGVEGFNCYF
PLQSYGFQPTNGVGYQPYRVVVLSFELLHAPATVCGPKKSTNLVKNKCVNFNFNGLTGTGVLTESNKKFL
PFQQFGRDIADTTDAVRDPQTLEILDITPCSFGGVSVITPGTNTSNQVAVLYQDVNCTEVPVAIHADQLT
PTWRVYSTGSNVFQTRAGCLIGAEHVNNSYECDIPIGAGICASYQTQTNSPRRARSVASQSIIAYTMSLG
AENSVAYSNNSIAIPTNFTISVTTEILPVSMTKTSVDCTMYICGDSTECSNLLLQYGSFCTQLNRALTGI
AVEQDKNTQEVFAQVKQIYKTPPIKDFGGFNFSQILPDPSKPSKRSFIEDLLFNKVTLADAGFIKQYGDC
LGDIAARDLICSNNSNNSNVLPPLLTDEMIAQYTSALLAGTITSGWTFGAGAALQIPFAMQMAYRFNGIG
VTQNVLYENQKLIANQFNSAIGKIQDSLSSTASASILLQHPNINQNKKLNTLVKQLSSNFGAISSVLNDI
LSRLDKVEAEVQIDRLITGRLQSLQTYVTQQLIRAAEIRASANLAATKMSECVLGQSKRVDFCGKGYHLM
SFPQSAPHGVVFLHVTYVPAQEKNFTTAPAICHDGKAHFPREGVFVSNGTHWFVTQRNFYEPQIITTDNT
FVSGNCDVVIGIVNNTVYDPLQPELDSFKEELDKYFKNHTSPDVDLGDISGINASVVNIQKEIDRLNEVA
KNLNESLIDLQELGKYEQYIKWPWYIWLG
```
## Working with DNA sequences {#sec-dna-sequences}
Finding similar DNA sequences is harder than finding similar proteins — the amount
of data to search through is considerably larger. For DNA queries we have three
main tools: **blastn**, **tblastx**, and **blastx**.
### BLASTN at NCBI {#sec-blastn-ncbi}
BLASTN compares a nucleotide query against a nucleotide database. All current
BLAST algorithms use BLAST 2.0, which allows gaps in alignments by default,
enabling both local and global alignments — suitable for most applications.
### BLASTX at NCBI {#sec-blastx-ncbi}
*blastx* takes a nucleotide query, translates it in all six frames, and compares
those translations to a protein database — useful for finding proteins encoded by
a nucleotide query. Because it combines significance statistics across frames, it
is especially useful when the reading frame is unknown or the query contains
frame-shift errors. It is often the first analysis performed on a newly determined
nucleotide sequence and is used extensively for EST analysis; it is more sensitive
than nucleotide BLAST because the comparison happens at the protein level.
::: {.callout-tip title="✅ Exercise 5.5 — BLASTX"}
1. Find the gene for the human HBG1 hemoglobin, gamma A.
2. Run a *blastx* with the gene sequence. Compare the results with the gene
structure in @fig-hbg1.
3. Explain why *blastx* is more sensitive than nucleotide–nucleotide BLAST.
4. Save the result in a file.
:::
::: {.content-hidden when-format="pdf" unless-profile="solutions"}
::: {.callout-tip collapse="true" title="Solution 5.5"}
- blastx returns hits only at the two protein-coding **exons** of HBG1, matching the
structure in @fig-hbg1; the intron and UTRs give no protein hit.
- It is more sensitive because it aligns at the *protein* level: synonymous codons
and conservative amino-acid substitutions make distant homologues detectable even
when their DNA sequences have diverged.
:::
:::
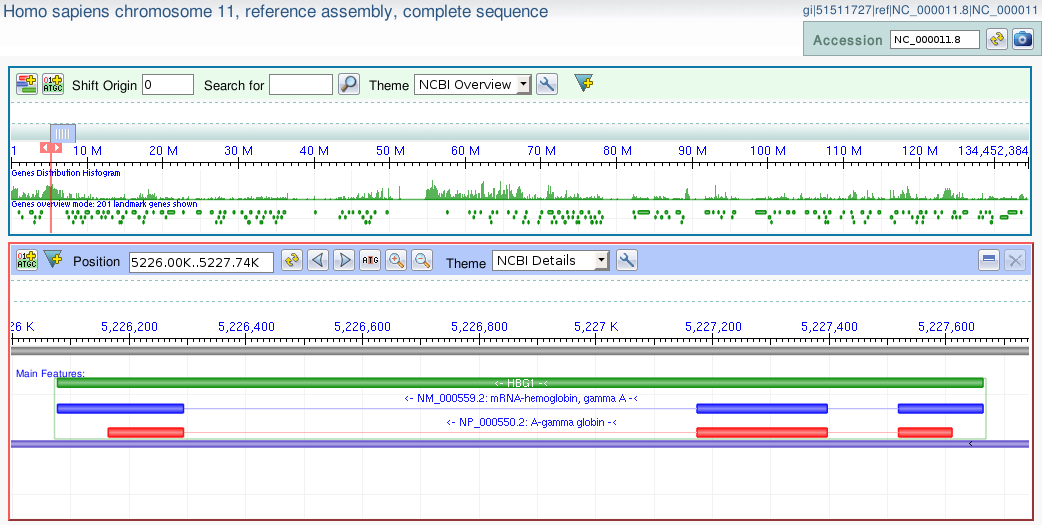{#fig-hbg1 width=100% fig-alt="Structure of the HBG1 hemoglobin, gamma A gene from NCBI."}
### TBLASTX at NCBI {#sec-tblastx-ncbi}
*tblastx* takes a nucleotide query, translates it in all six frames, and compares
those to database sequences dynamically translated in all six frames — effectively
a more sensitive blastp search without manual translation. It circumvents
frame-shifts and ambiguities that may hide open reading frames, which is very
useful for identifying potential proteins encoded by single-pass EST reads[^est-note]
and for discovering novel genes.
[^est-note]: An expressed sequence tag (EST) is a short sub-sequence of a
transcribed, spliced nucleotide sequence (coding or not).
::: {.callout-tip title="✅ Exercise 5.6 — TBLASTX"}
1. Run a *tblastx* with the human HBG1 hemoglobin, gamma A gene sequence. Observe
and discuss the results.
2. What is the main difference from the previous methods?
3. Compare the results with the gene structure.
:::
::: {.content-hidden when-format="pdf" unless-profile="solutions"}
::: {.callout-tip collapse="true" title="Solution 5.6"}
- **blastn**: only sequences that are *exactly* similar at the DNA level (recently
diverged). **blastx**: one fixed protein translation vs the protein DB.
**tblastx** translates *both* the query and every database entry in all six frames,
finding homologous coding regions even between sequences whose DNA has diverged —
the most sensitive but slowest of the three.
:::
:::
## SARS-CoV-2 {#sec-sars-cov-2}
Severe acute respiratory syndrome coronavirus 2 (SARS-CoV-2) is the virus causing
COVID-19. The outbreak, which presumably started from a local seafood market,
grew to infect 2761 people in China by 26 January 2020 [@Zhou2020]. It is the
seventh known coronavirus to infect people, after 229E, NL63, OC43, HKU1,
MERS-CoV, and the original SARS-CoV (2003).
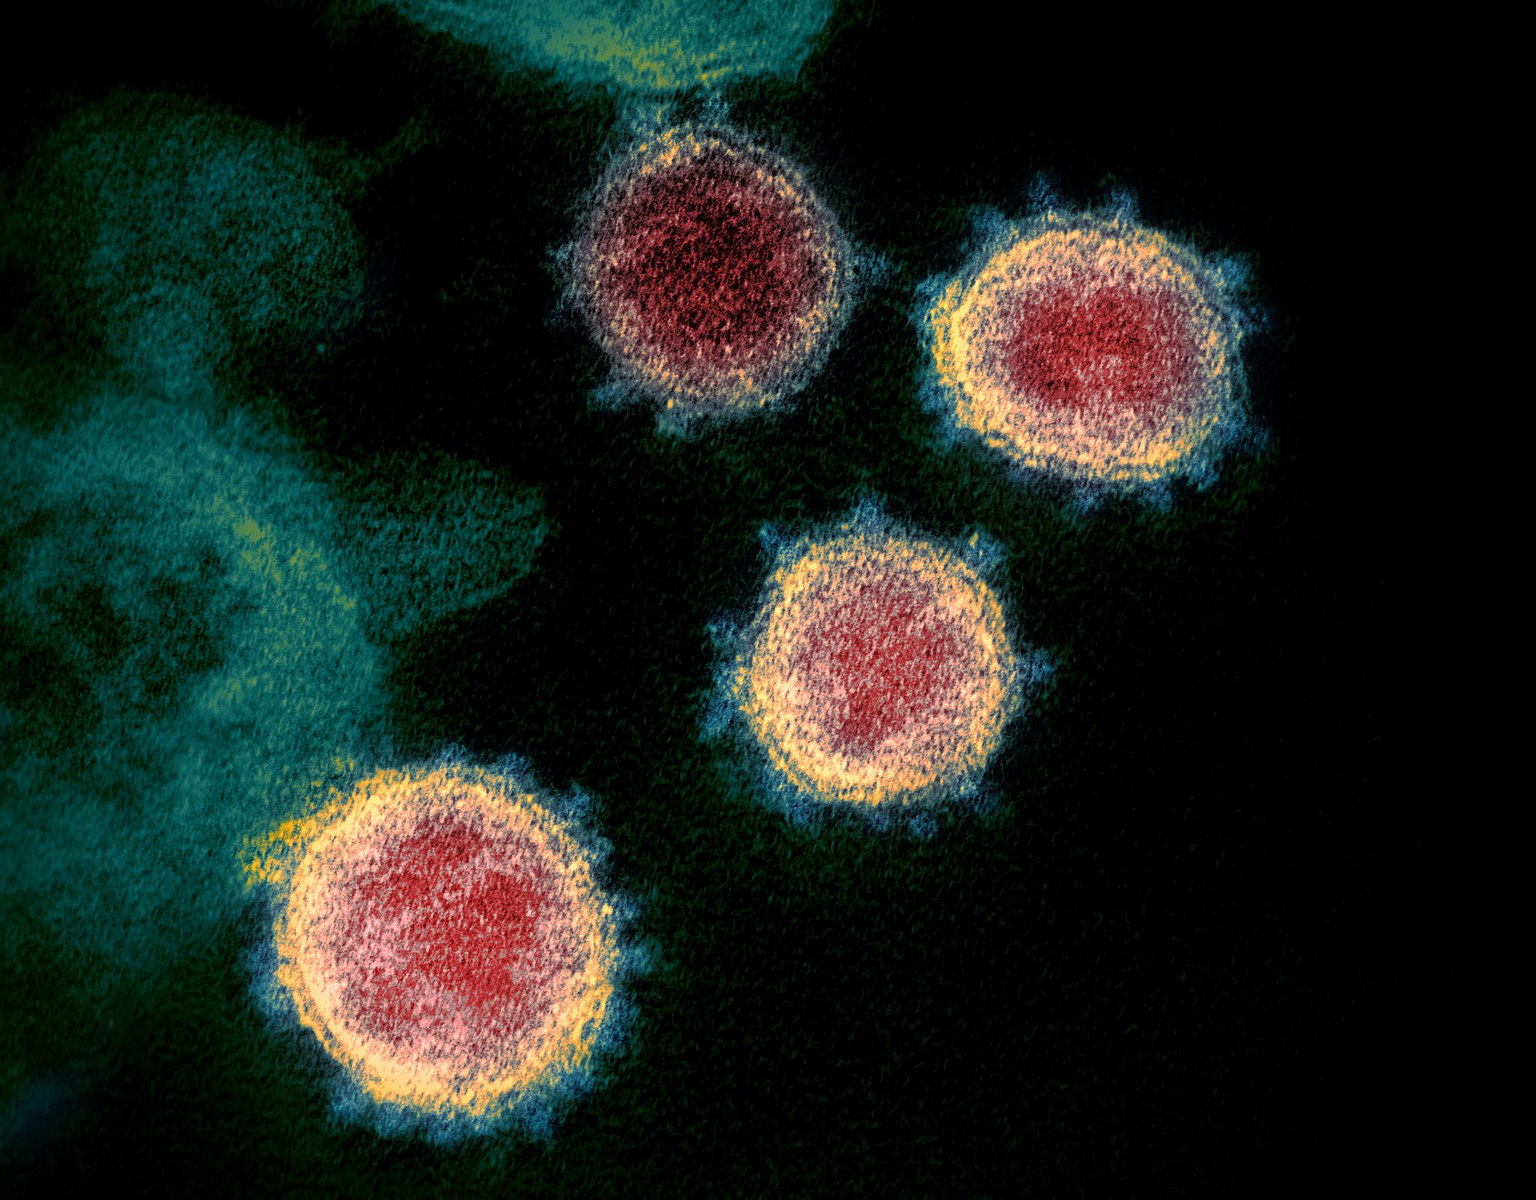{#fig-sars width=50% fig-alt="Transmission electron microscope image of SARS-CoV-2 (from Wikimedia)."}
The first known SARS-CoV-2 sequence was published on 2 February 2020 (revised
11 February) [@Wu2020] under GenBank annotation *MN908947.3*, from a single
patient — a worker at a local market admitted to the Central Hospital of Wuhan on
26 December 2019 with a severe respiratory syndrome. Metagenomic RNA sequencing of
bronchoalveolar lavage fluid identified a new RNA virus of the family
Coronaviridae, designated *WH-Human 1*. Phylogenetic analysis of the complete
29,903-nucleotide genome revealed the virus was most closely related (89.1%
nucleotide similarity) to a group of SARS-like coronaviruses (genus
*Betacoronavirus*, subgenus *Sarbecovirus*) previously found in bats in China.
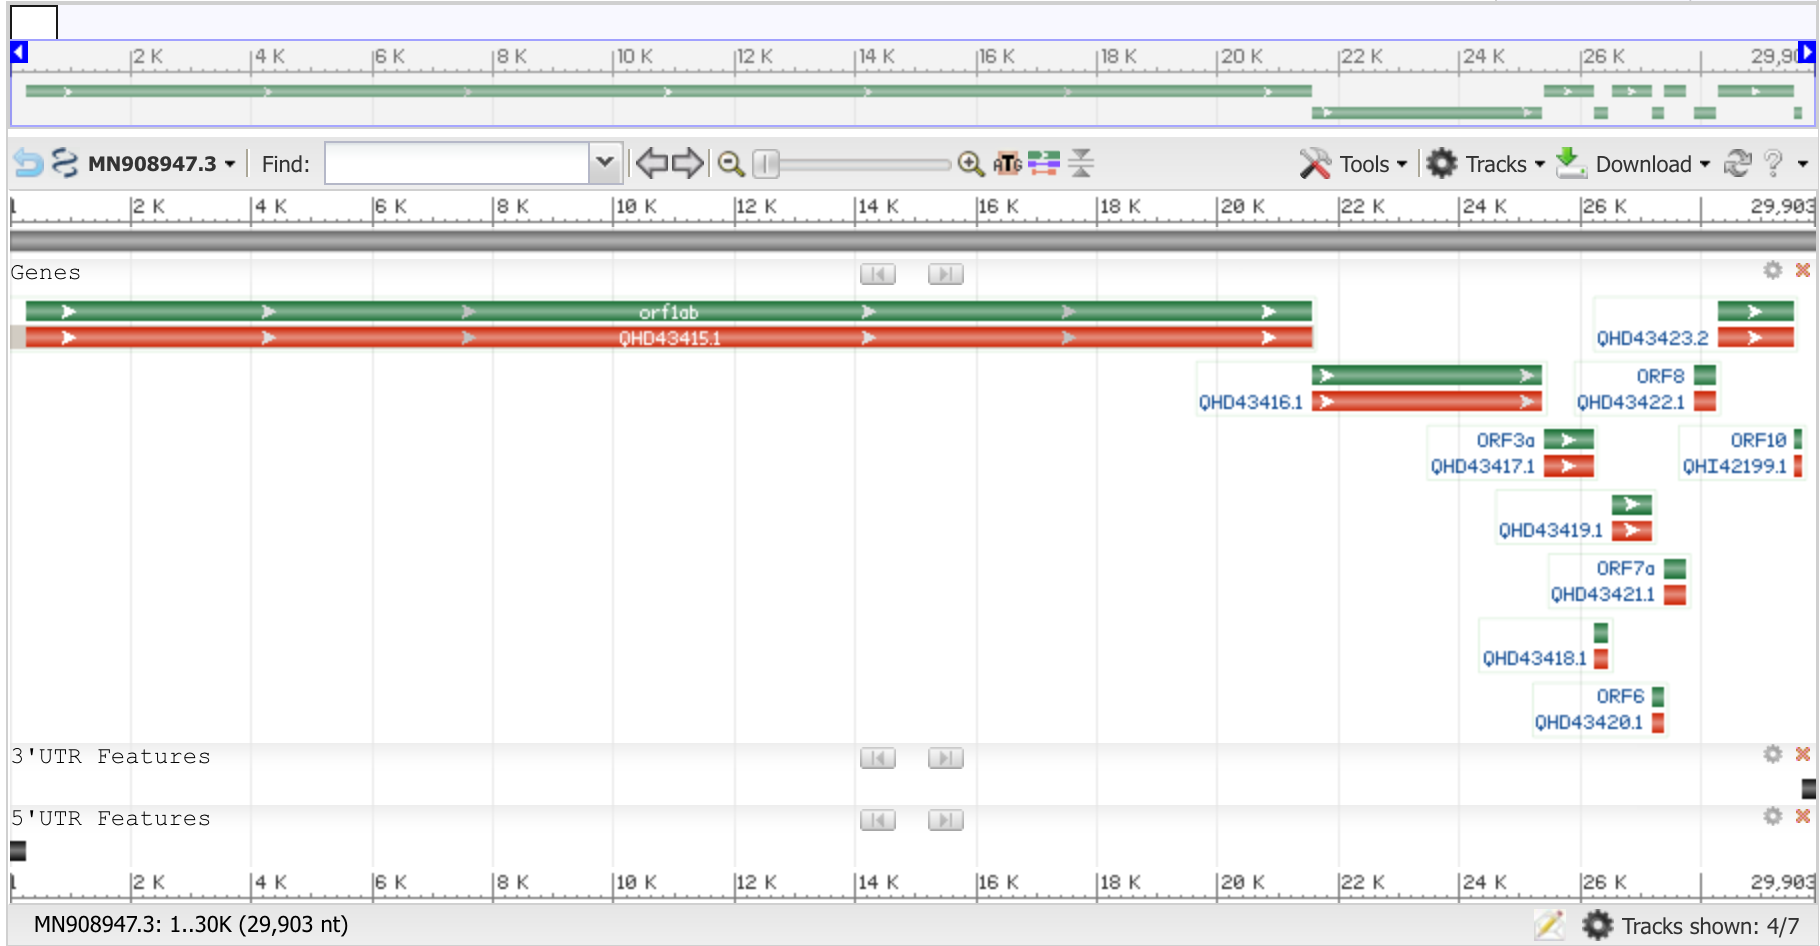{#fig-sars2 width=100% fig-alt="SARS-CoV-2 isolate Wuhan-Hu-1, complete genome (GenBank MN908947.3)."}
The genes annotated on MN908947.3 are listed in @tbl-sars-genes.
| # | Accession | Start | Stop | Gene symbol | Strand |
|--:|-----------|------:|-----:|-------------|--------|
| 1 | MN908947.3 | 266 | 21555 | orf1ab | plus |
| 2 | MN908947.3 | 21563 | 25384 | S | plus |
| 3 | MN908947.3 | 25393 | 26220 | ORF3a | plus |
| 4 | MN908947.3 | 26245 | 26472 | E | plus |
| 5 | MN908947.3 | 26523 | 27191 | M | plus |
| 6 | MN908947.3 | 27202 | 27387 | ORF6 | plus |
| 7 | MN908947.3 | 27394 | 27759 | ORF7a | plus |
| 8 | MN908947.3 | 27894 | 28259 | ORF8 | plus |
| 9 | MN908947.3 | 28274 | 29533 | N | plus |
| 10 | MN908947.3 | 29558 | 29674 | ORF10 | plus |
: Genes listed on MN908947.3 {#tbl-sars-genes}
::: {.callout-tip title="✅ Exercise 5.7 — SARS-CoV-2"}
1. Run a homology search on the full SARS-CoV-2 sequence. Explain which virus
sequences are homologous to 2020 SARS-CoV-2, and in which regions.
2. Plan and run a strategy for analysing the different elements of the SARS-CoV-2
sequence — its proteins and active domains. Learn as much as you can about this
virus in terms of homology to any known sequence.
:::
::: {.content-hidden when-format="pdf" unless-profile="solutions"}
::: {.callout-tip collapse="true" title="Solution 5.7"}
- A nucleotide blastn of the ~29.9 kb genome returns bat SARS-like coronaviruses
(e.g. *RaTG13*, ~96 % identity) and the 2003 SARS-CoV (~82 %), most conserved in
the **orf1ab** replicase and the nucleocapsid, and most *divergent* across the
**S (spike)** gene.
- A sensible strategy is to blastn the full genome, blastx each annotated CDS from
@tbl-sars-genes, and run CD-search on the spike and orf1ab polyprotein to locate
the receptor-binding and protease domains.
:::
:::
## Doing it in R {#sec-homology-r}
The web interfaces above are how you'll usually explore a single query, but for
reproducible work you want the search and alignment **in code**. Bioconductor's
`Biostrings` aligns sequences locally, and `ape` builds trees — both run offline.
We illustrate the mechanics on a small set of synthetic sequences (one seed and
progressively more mutated copies), so the results are reproducible anywhere:
```{r}
#| label: make-seqs
#| message: false
library(Biostrings)
library(pwalign)      # pairwiseAlignment()/stringDist() live here since BioC 3.19
set.seed(1)
aa <- strsplit("ACDEFGHIKLMNPQRSTVWY", "")[[1]]
seed <- paste(sample(aa, 80, replace = TRUE), collapse = "")
mutate <- function(s, n) {
  v <- strsplit(s, "")[[1]]; pos <- sample(length(v), n)
  v[pos] <- sample(aa, n, replace = TRUE); paste(v, collapse = "")
}
seqs <- AAStringSet(c(seed = seed, near = mutate(seed, 6),
                      mid = mutate(seed, 18), far = mutate(seed, 34),
                      distant = mutate(seed, 52)))
seqs
```
A **pairwise alignment** with BLOSUM62 scores similarity — high for the near copy,
low for the distant one, exactly as an e-value would rank them:
```{r}
#| label: pairwise
pa_near <- pairwiseAlignment(seqs[["seed"]], seqs[["near"]],
                             substitutionMatrix = "BLOSUM62",
                             gapOpening = 10, gapExtension = 4)
pa_far  <- pairwiseAlignment(seqs[["seed"]], seqs[["distant"]],
                             substitutionMatrix = "BLOSUM62",
                             gapOpening = 10, gapExtension = 4)
c(near = score(pa_near), distant = score(pa_far))
pid(pa_near) # percent identity of the close pair
```
From all-vs-all distances we can build and draw a **neighbour-joining tree**
(@fig-nj), the same idea as the BLAST "Distance Tree view":
```{r}
#| label: fig-nj
#| fig-cap: "Neighbour-joining tree of the illustrative sequences, recovering the mutation order from the seed."
#| fig-alt: "An unrooted neighbour-joining tree with the seed and near sequences close together and the distant sequence on a long branch."
#| fig-width: 6
#| fig-height: 3.6
library(ape)
d <- stringDist(seqs, method = "hamming")
plot(nj(d), type = "unrooted", cex = 0.9, no.margin = TRUE)
```
::: {.callout-note appearance="minimal" title="Searching a real database from R"}
To search NCBI itself, fetch sequences with `rentrez` and run BLAST locally with
`rBLAST` (a wrapper around NCBI BLAST+). These need network access and a BLAST
install, so they are shown, not run here:
```r
library(rentrez); library(rBLAST)
ldlr <- entrez_fetch(db = "protein", id = "NP_000518", rettype = "fasta")
# ... write to a FASTA, then:  blast(db = "swissprot") |> predict(query)
```
For multiple alignment and publication-quality trees, add `msa`/`DECIPHER` and
`ggtree`.
:::
## Further reading
- Altschul *et al.* (1990), *J. Mol. Biol.* — the original BLAST paper.
- [NCBI BLAST documentation](https://blast.ncbi.nlm.nih.gov/doc/blast-topics/) and the [EBI Job Dispatcher](https://www.ebi.ac.uk/jdispatcher/sss) help.
- The `Biostrings` / `pwalign` and `ape` vignettes for the in-R alignment and tree code.
::: {.content-visible when-format="html" unless-profile="solutions"}
Worked solutions for the exercises are in the collapsed callouts below each exercise.
:::
::: {.content-visible when-format="html" when-profile="solutions"}
Solutions to Exercises 5.2, 5.5–5.7 are in the [Solutions appendix](../appendix/solutions.qmd#lab-5--homology) and in the collapsed callouts above.
:::
::: {.content-visible when-format="pdf" unless-profile="solutions"}
Worked solutions for this lab are omitted from this PDF — find them as collapsed callouts in the HTML edition.
:::
## Report {#sec-report-homology}
Write a laboratory report following the structure of this text. It should contain
an introduction, the goals of each section, and a description of the results of
each part. Include any graphics relevant to making your work understandable.
**The lab should be delivered within two weeks.**








