Bioinformatics · Universitat Politècnica de Catalunya
Alexandre Perera-Lluna
Motivation
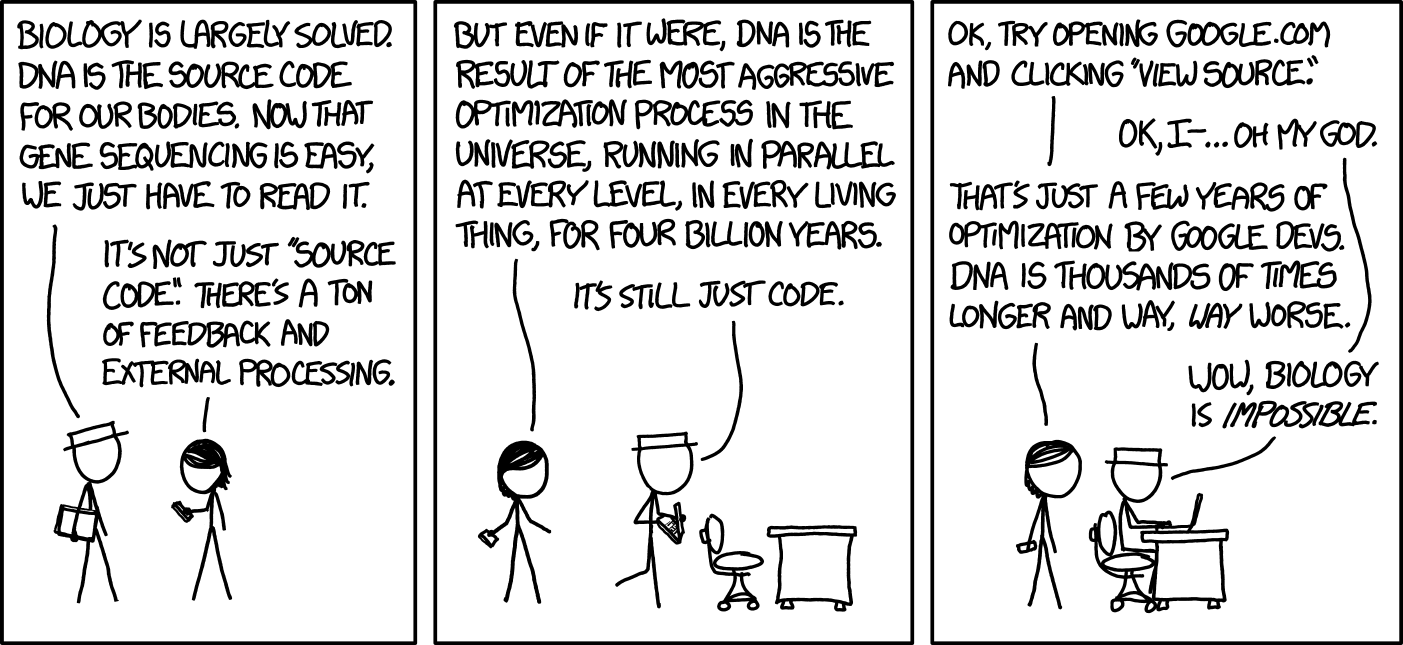
xkcd 1605 “DNA” — Randall Munroe, xkcd.com/1605, CC BY-NC 2.5.
Contents
Sequence properties and profiles
Homology and pairwise alignment
Scoring: substitution matrices and gaps
Optimal alignment by dynamic programming: global and local
Statistical significance, BLAST and FASTA
Multiple sequence alignment
Motivation
Prediction of biological and structural properties from sequences is a key goal in computational biology.
Recognise transmembrane proteins from sequence alone (about 25% of all proteins).
Classify proteins into classes of similar function from sequence similarity.
These proteins mediate communication and transport between cells, and are central to recent pharmaceutical developments.
Sequence Analysis
Per-Sequence Analysis
Limited information.
Analyzed solely from sequence information (residues).
Characteristics of residues
Physical, chemical: hydrophobicity (amino acids)
Statistical: GC islands (DNA); codon usage
Between Sequences
More informative.
Mainly based on homology.
Common ancestry and sequence similarity.
Homology indicates common ancestry. Shared function requires additional evidence.
The base of homology recognition is the similarity concept between two sequences.
Genes come in families -> multiple sequence analysis.
Profiles
Amino acid Features
Size.
Flexibility in the backbone.
Charge.
…
Argos
Argos (1987). A sensitive Procedure to Compare Amino acid Sequences. J. Mol. 193:385-396
Hydrophobicity.
Turn Preference.
Residue Bulk or Shape.
Refractivity Index.
Antiparallel strand preference.
Most computed in a sliding window approach.
Sequence profiles
Features on individual amino acids play some role in protein early secondary structure formation
Glutamate is frequently found in alpha helices
Valine has a preference for beta strands.
Proline is strongly avoided in helices
Hydrophobicity scales
Hydrophobicity
Physico-chemical property
Kyte-Doolittle
Widely applied scale for delineating hydrophobic character of a protein. with values above 0 are hydrophobic in character.
Hopp-Woods
Designed for predicting potentially antigenic regions.
Values greater than 0 are hydrophilic and thus likely to be exposed on the surface of a folded protein.
Both are computed on a sliding window, like the Argos profiles above.
Hydrophobicity: the two scales side by side
Kyte-Doolittle
Hopp-Woods
Alanine
1.8
-0.5
Arginine
-4.5
3.0
Asparagine
-3.5
0.2
Aspartic acid
-3.5
3.0
Cysteine
2.5
-1.0
Glutamine
-3.5
0.2
Glutamic acid
-3.5
3.0
Glycine
-0.4
0.0
Histidine
-3.2
-0.5
Isoleucine
4.5
-1.8
Kyte-Doolittle
Hopp-Woods
Leucine
3.8
-1.8
Lysine
-3.9
3.0
Methionine
1.9
-1.3
Phenylalanine
2.8
-2.5
Proline
-1.6
0.0
Serine
-0.8
0.3
Threonine
-0.7
-0.4
Tryptophan
-0.9
-3.4
Tyrosine
-1.3
-2.3
Valine
4.2
-1.5
Values from Black, S.D. and Mould, D.R. (1991) Anal. Biochem. 193, 72–82. Sign conventions differ: Kyte-Doolittle > 0 marks hydrophobic residues; Hopp-Woods > 0 marks hydrophilic, exposed ones.
Hydrophobicity Profiles
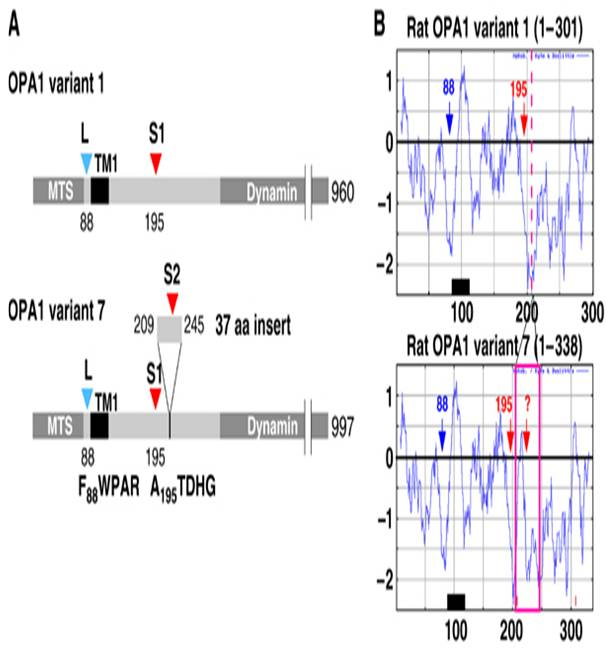
Rat OPA1 windowed hydropathy: TM1 (≈residue 100) is the only clear hydrophobic peak; variant 7 adds a 37-aa hydrophilic insert.
Pairwise alignment
Evolution suggests
All gene sequences may have derived from common ancestral sequences.
Trace the evolutionary history of mutations will help us to understand functionality and structure
Comparing two sequences
Which is this mutation path, using:
Insertions.
Deletions.
Mutations.
… to turn a sequence into another?
Distance between sequences.
Why is it useful?
May provide information whether sequence contains protein-coding gene.
Similarity on sequence may hint first clues on the type of protein the gene codes.
Protein Structure Prediction.
Compare DNA information between organisms -> Phylogenetic tree.
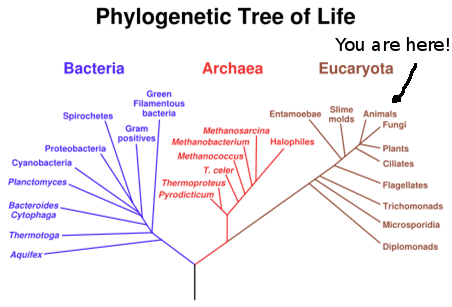
Phylogenetic Tree of Life
Based on 16S rRNA genetic sequences. Woese C, Fox G (1977).”Phylogenetic structure of the prokaryotic domain: the primary kingdoms”. Proc Natl Acad Sci USA 74 (11): pp. 5088–90
Homology, orthology and paralogy
Homology
Similarity between characters that is due to their shared ancestry — a qualitative relationship, not a percentage.
Orthology
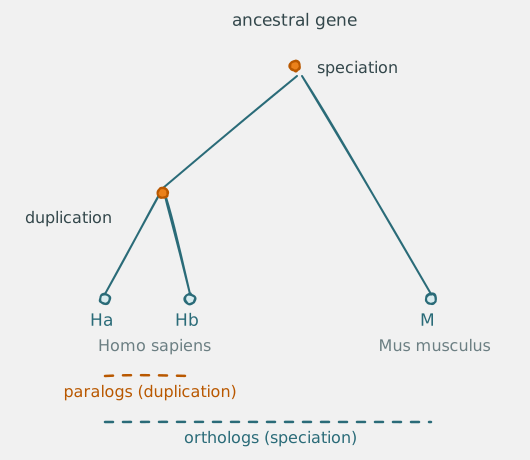
Genes in different species whose last shared event is speciation (orthologs).
Paralogy
Genes whose last shared event is a gene duplication (paralogs): a duplicated gene occupying a second position in the same genome.
Paralogs often keep similar functions; freed from the original selective pressure, one copy may mutate and acquire a new function.
Sequence similarity and ancestry
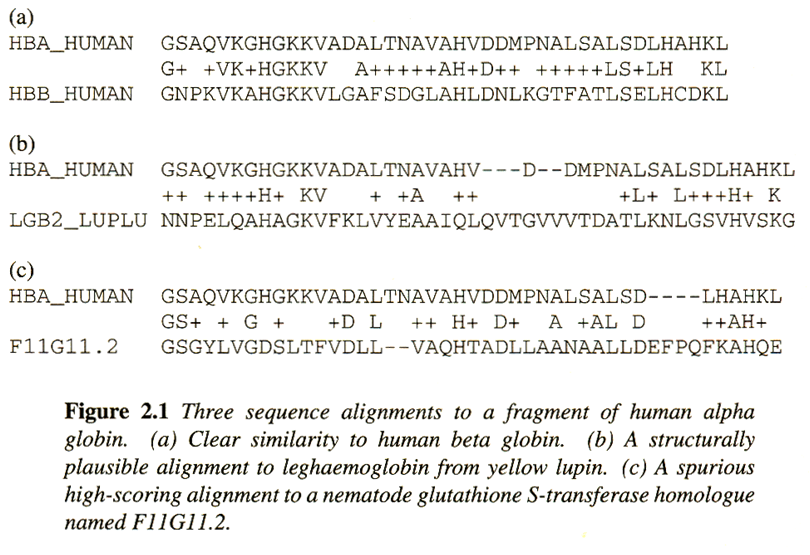
Alignment places residues into corresponding positions under a scoring model.
Identical residues can arise through common ancestry or by chance.
Statistically significant similarity can provide evidence for homology.
What can’t we see with sequence similarity?
Convergent Evolution
Sequence Alignment
Sequence alignment is:
A task of locating equivalent regions of two or more sequences to maximize their similarity
Sequence Alignment: some notes
Better on AA or NN sequences?
Is easier to detect homology when comparing protein sequences than when comparing nucleic acid sequences.
1) Just 4 symbols in DNA, 20 in AA chain
Given the same sequence length,
AAs sequence provides with more information
Similarity by chance is much more probable in Nucleotide sequences (for the same sequence length).
Sequence Alignment: some notes
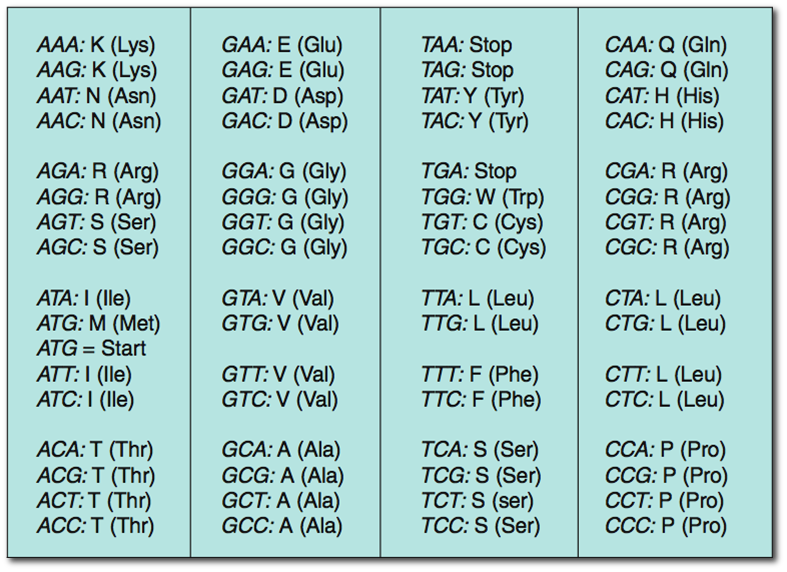
The Genetic Code is Redundant
There are two or more different codons for most amino acids.
Dot Plots
Local and global similarity
Local similarity: similar regions within sequences that may differ elsewhere.
Global similarity: similarity across the full lengths of the sequences.
Why use a dot plot?
Visualise similarities without first choosing a local or global alignment.
Identify matching regions between two sequences.
Detect repeats within a sequence.
GlobalT F T T A L I L L A V A V
F -- T A L - L L A - A V
LocalT F T T A L I L L - A V A V
-- F T A L - L L A A V --
The same pair, aligned globally (upper rows: gaps added where the ends are forced together) and locally (lower rows: only the best-scoring stretch is kept, gaps at the trimmed ends).
Dot Plots
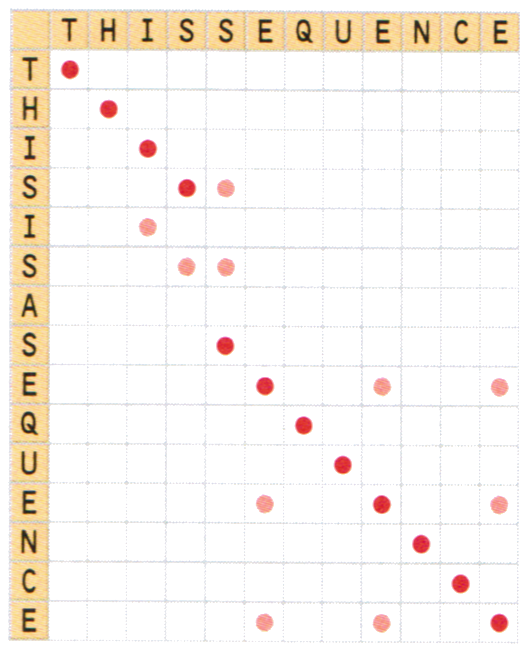
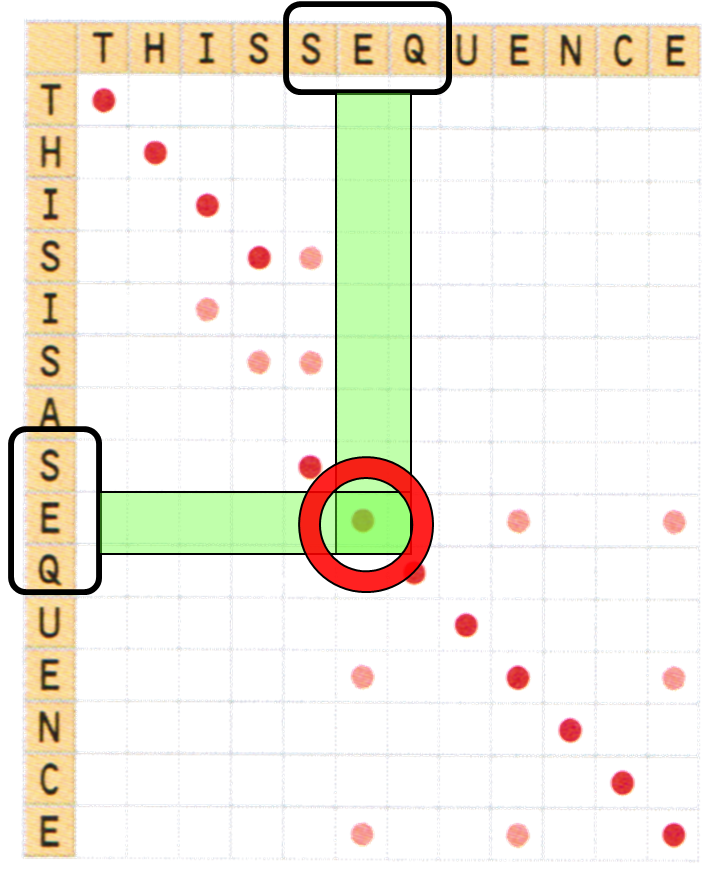
Raw single-residue matches: the diagonal shows through, but isolated chance dots bury the pattern. Sequences here: THISISASEQUENCE vs THISSEQUENCE.
Dot Plots
With a 3-residue window, matches are judged over whole windows: the SEQ / SEQ match is confirmed (green) and isolated dots no longer count.
Dot Plots
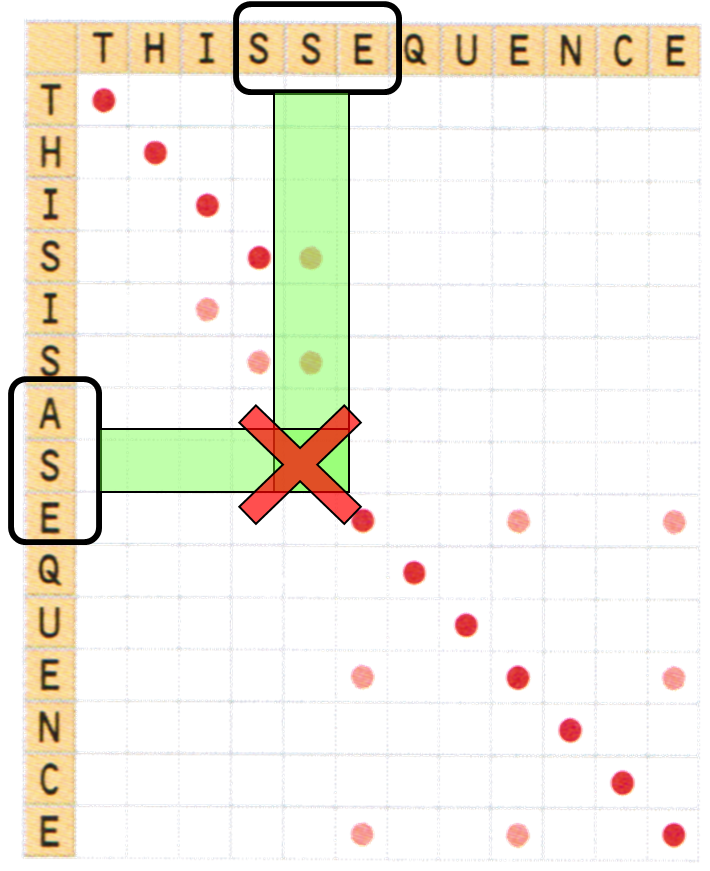
The same rule rejects the wrong residues: SSE / ASE shares too little inside the window — no match.
Dot Plots
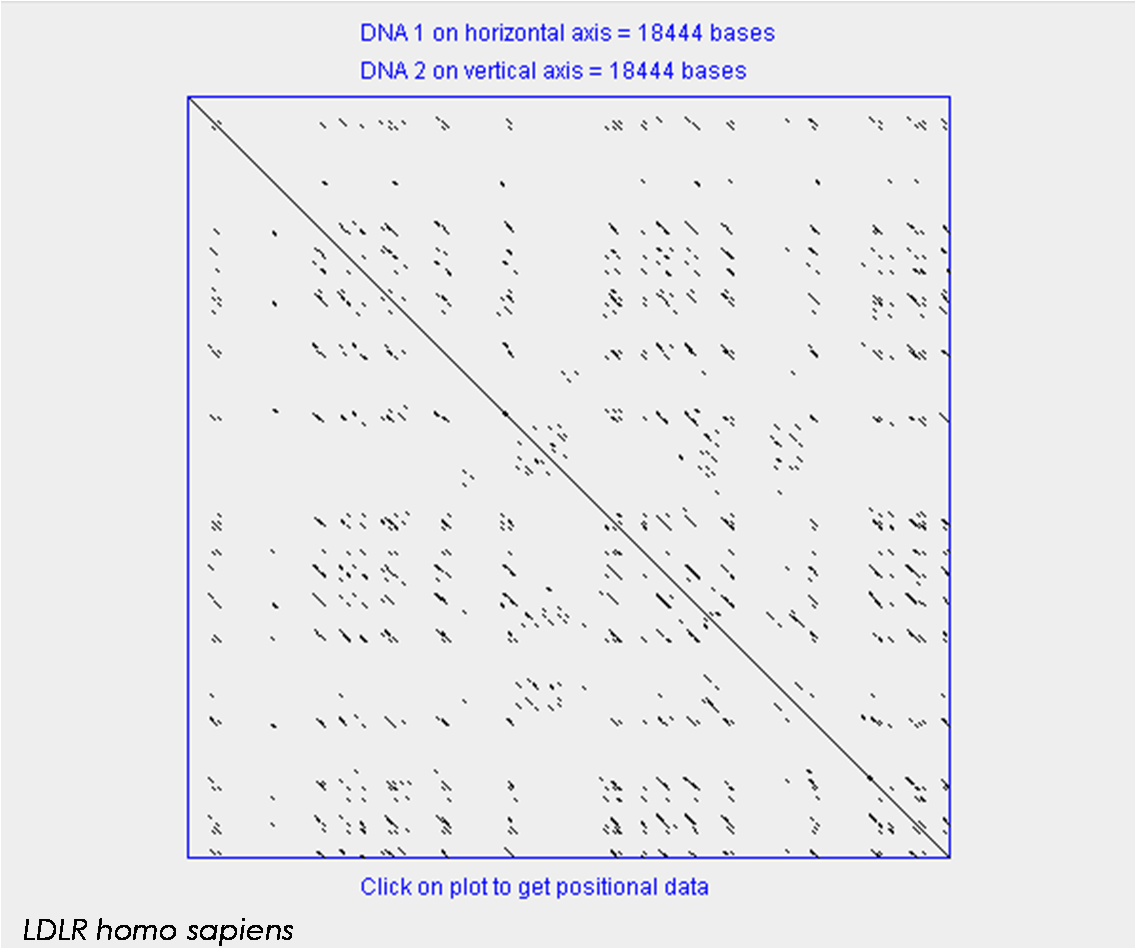
The human LDL-receptor gene (18,444 bases) against itself: beyond the main diagonal, entire families of repeats populate the introns — the reality of whole-gene dot plots.
Dot Plots: Window Length
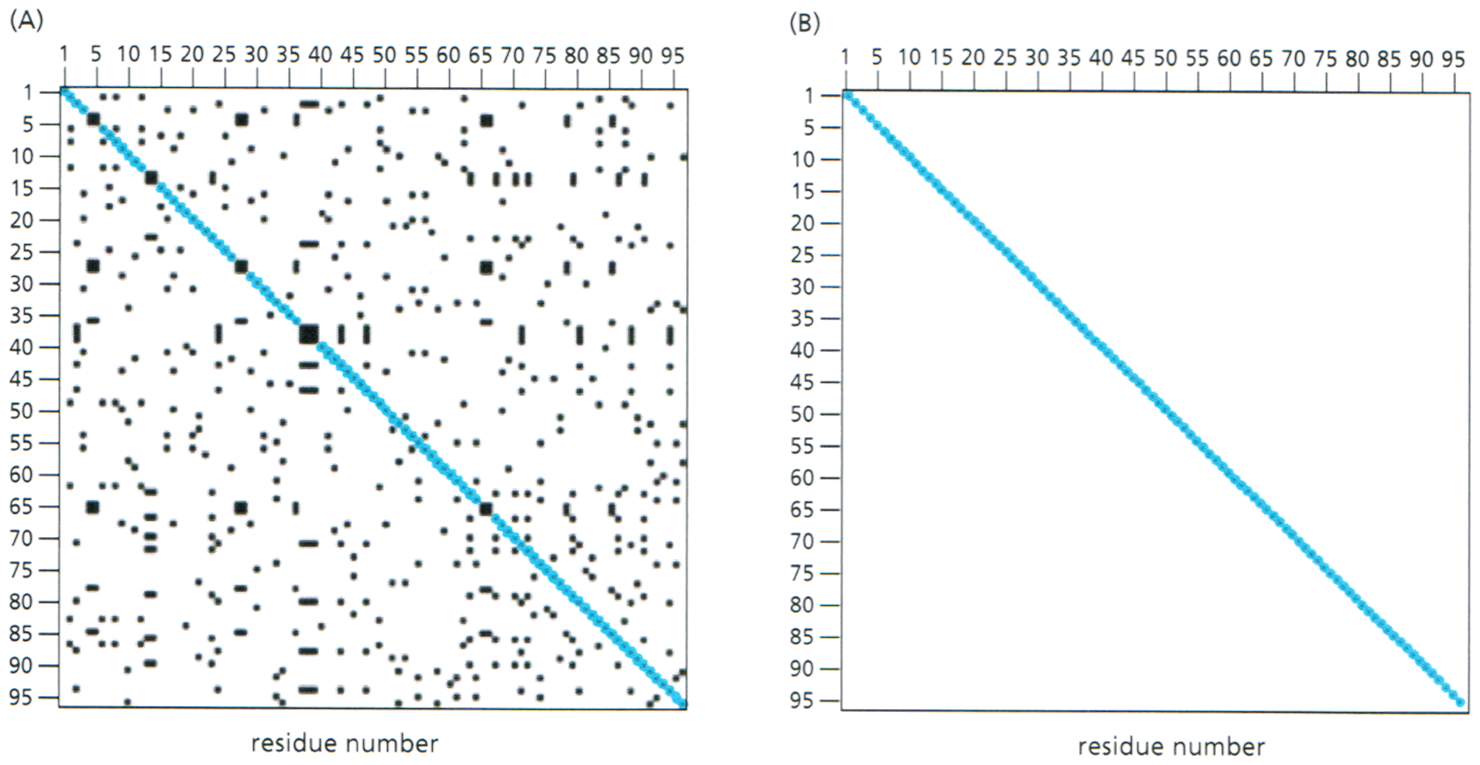
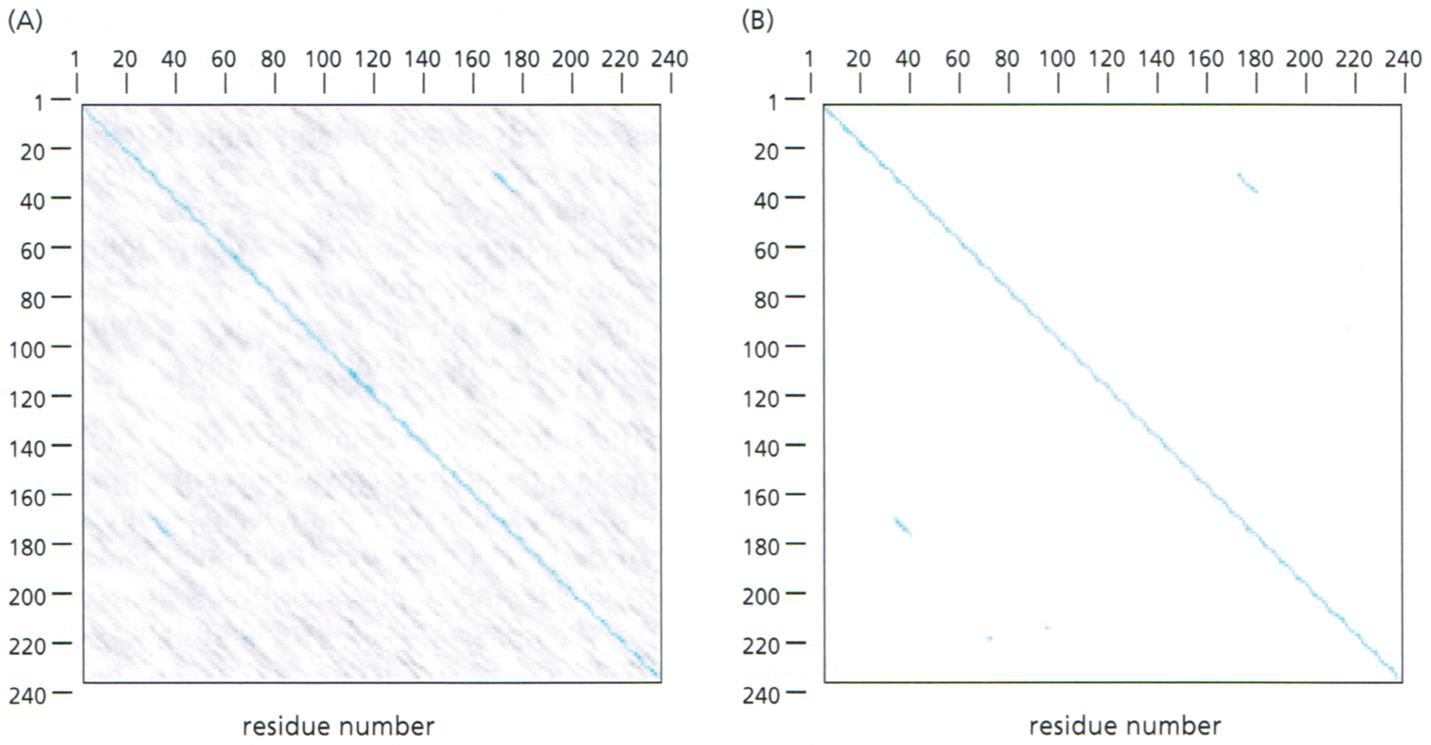
Self-comparison of a 95-residue sequence: single-residue matches (A) are mostly noise; a window filter with higher stringency (B) keeps the main diagonal alone.
Dot Plots: Window Length (SH2)
A 240-residue SH2-containing protein: filtering reveals the main diagonal — plus two short off-diagonal matches (internal similarity).
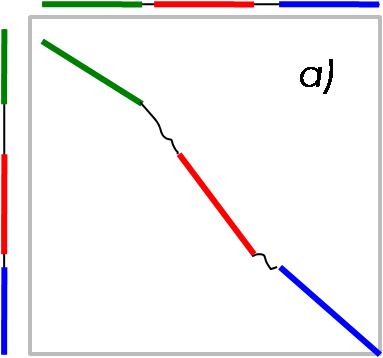
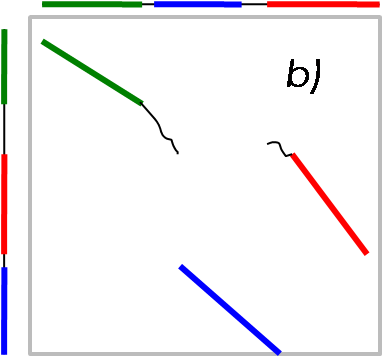
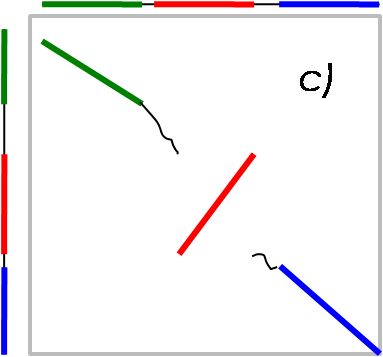
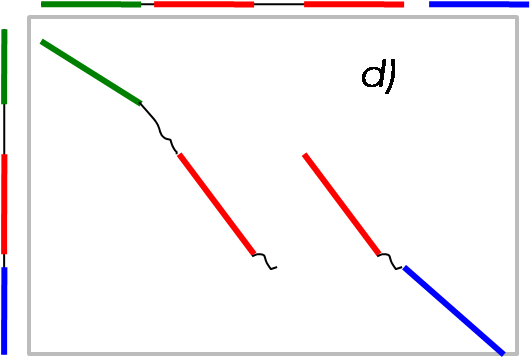
Dot plots: rearrangement patterns
No rearrangement — one continuous diagonal
Translocation — segments meet at unrelated offsets
Inversion — an anti-parallel (reversed) segment
Duplication — one segment matches twice
Amino acid Sequence Alignment
AA Sequence Alignment
Responds to the question whether any two sequences are related.
Four Main Steps
What sort of alignment should be considered?
What scoring system will rank alignments?
Which algorithm will seek good scoring alignments?
How do we assess the significance of an alignment score?
Alignment in AA sequences
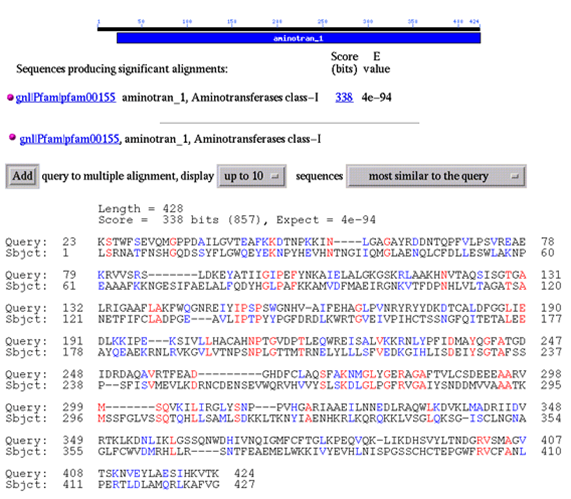
What the procedure can yield: a BLAST report with a 338-bit alignment (E = 4 × 10⁻⁹⁴) of the aminotrans_1 query to a Pfam class-I aminotransferase family.
Scoring homologous sequences
Homologous sequences can have different length.
Insertions, deletions, indels….. Marked as “-”
On Statistical Significance
A simple alignment score
For an aligned pair of sequences, assign a score to each column:
Column
Score
Match
0
Mismatch
−1
Gap character
−G
The obvious strategy fails
Assume an alignment.
Score every column (table above).
Sum over all positions to get a score.
Repeat for all possible alignments — astronomically many, even for two moderately sized sequences.
There is a better way!
Dynamic programming reuses intermediate prefix scores instead of enumerating every alignment.
A Better Scoring
The total score is the sum of column terms for aligned pairs, plus gaps.
Identities and conservative substitutions
More likely in real alignments; positive scores.
Non-conservative changes
Less frequent in real alignments; negative scores.
Additive scoring
An Additive score system
Assumes mutations at different sites occurs independently.
This assumption is reasonable for DNA and proteins.
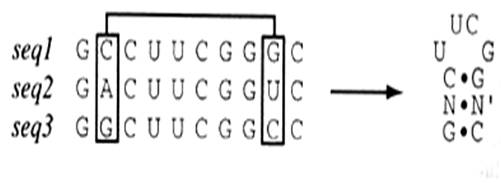
Could be not suitable for some RNA sequences.
Probability models: first, the notation
position i
1
2
3
4
5
6
x
S
E
N
D
M
K
y
A
E
N
D
L
Q
Two aligned, gap-free sequences of equal length — the situation the models assume. The index i counts alignment columns.
Each column is judged against two models
Highlighted column, i=4: x4= D and y4= D.
Chance (background) model:qx4=qD and qy4=qD are just background residue frequencies — qD≈5.4% across a protein database. The column’s chance probability is qx4qy4=qD2≈0.3%.
Related (pair) model:px4y4=pDD = how often D sits opposite D inside conserved blocks — usually much more than 0.3%.
Same arithmetic for the mismatch column i=5: qx5qy5=qMqL≈0.25%. The substitution score (next) compares related vs chance, column by column.
Sequence probability models
For aligned, ungapped sequences of equal length, let qa denote a background residue probability and pab an aligned-pair probability.
Independent background model
P(x,y∣R)=i∏qxiqyi
Aligned-pair model
P(x,y∣M)=i∏pxiyi
The models assume independence between alignment columns.
Log-odds alignment scores
The odds ratio compares the two models:
P(x,y∣R)P(x,y∣M)=i∏qxiqyipxiyi.
Taking logarithms gives an additive score:
s(a,b)=logqaqbpab,S=i∑s(xi,yi).
The logarithm base and scaling determine the score units.
Substitution matrices
s(a,b) defines a matrix, known as score matrix or substitution matrix (SM).
A symmetric matrix for 20 amino acids has 210 distinct residue-pair entries, including the diagonal; gap penalties are separate.
Two main Substitution Matrices are usually employed:
PAM matrices model accepted point mutations.
BLOSUM, or BLOck SUbstitution Matrices, are built from gap-less conserved blocks.
Accepted point mutations (PAM)
Computed by Margaret Dayhoff in 1978 (also known as Dayhoff matrices): 1572 accepted point mutations in 71 families of closely related proteins.
PAM1 models an average of 1 accepted mutation per 100 residues; PAMn is PAM1 raised to the power n — PAM250 models strongly diverged sequences.
After many cycles a residue may mutate several times — even back to its original state — so PAM distance is not proportional to evolutionary time: families evolve at different rates.
BLOSUM, or BLOck SUbstitution Matrices
Henikoff and Henikoff, 1992: built from local alignments — the BLOCKS database of gap-less conserved blocks of protein families.
High numbers (BLOSUM80): closely related sequences; low numbers (BLOSUM45): more divergent ones.
BLOSUM62 is the de facto standard in protein database searches and sequence alignments.
PAM or BLOSUM?
PAM (Dayhoff, 1978)
BLOSUM (Henikoff, 1992)
Built from
closely related families
gap-less conserved blocks
Alignment used
global
local
Numbering
higher = more diverged (PAM250)
higher = closer (BLOSUM80)
Typical choice
distant relatives
searches: 80, 62, 45
Match the matrix to the expected divergence: there is no universally correct matrix.
BLOSUM62: look up a residue-pair score
Reading BLOSUM62 scores
The score depends on which residues are aligned—not only whether they match.
Residue pair
BLOSUM62 score
Interpretation
W / W
+11
A tryptophan match
N / N
+6
An asparagine match
S / A
+1
A favourable non-identical pair
E / A
−1
An unfavourable pair
W / D
−4
A more strongly penalised pair
A substitution score is a log-odds score, not a mutation probability. Add the scores over aligned pairs; account for gaps separately.
Linear gap costs
For a gap of length k, subtract the cost d once per gap character:
γ(k)=−kd,d>0.
Gap length
At d=8
Contribution to the score
1
−
−8
2
−−
−16
3
−−−
−24
All worked examples in this section use BLOSUM62 and a linear gap cost of 8, unless you change it in the laboratory.
Affine gap costs
Opening one long gap can cost less than opening several short ones. Here o is the opening cost and e is the extension cost:
γ(k)=−o−(k−1)e,k≥1.
With o=8 and e=1:
Pattern
Calculation
Score contribution
One gap of length 3
−8−2×1
−10
Three separate gaps of length 1
3×(−8)
−24
favoured — one long gap: −8−6×1=−14
ATGTAGTGTATAGTACATGCA
ATGTAG——-TACATGCA
penalised — three openings: −3×8−(1+1+2)×1=−28
ATGTAGTGTATAGTACATGCA
ATGTA–G–TA—CATGCA
The simple recurrence we will use assumes linear costs. Affine costs require additional states, as in Gotoh’s algorithm.
Score an alignment, one column at a time
Column
1
2
3
4
x
S
E
N
D
y
A
−
N
D
Score
+1
−8
+6
+6
Total = 1 − 8 + 6 + 6 = 5.
This scores one proposed alignment. How do we find the best alignment without trying every possibility?
Dynamic programming: reuse prefix scores
A cell stores the best score for two prefixes of the sequences.
For example, F(2,3) aligns SEN with AN: the first three residues of x and the first two of y.
The last alignment column must contain a residue pair, a gap in x, or a gap in y. Each choice extends a smaller prefix alignment whose best score is already known.
Compute each cell once: mn interior cells for lengths m and n. This gives O(mn) time for the linear-gap model.
Needleman–Wunsch: align both complete sequences
Global alignment consumes every residue of both sequences, including their ends.
Stage
What to do
Initialise
Charge for aligning a prefix against an empty sequence.
Fill
Choose the best of three ways to enter each cell.
Trace back
Start at the bottom-right cell; stop at the origin.
The final score belongs to the bottom-right cell, even if another cell contains a larger value.
Global alignment: the recurrence
Rows consume yi; columns consume xj. Let F(i,j) be the best prefix-alignment score.
F(i,j)=max⎩⎨⎧F(i−1,j−1)+s(xj,yi)F(i−1,j)−dF(i,j−1)−dalign the two residuesgap in xgap in y
F(0,0)=0,F(i,0)=−id,F(0,j)=−jd.
Store every tied best predecessor. Several optimal alignments can share the same score.
Three moves, three alignment columns
Traceback move
Consume from x?
Consume from y?
Append this column
↖ Diagonal
Yes
Yes
residue / residue
↑ Up
No
Yes
− / residue
← Left
Yes
No
residue / −
Tracing backwards discovers the alignment from right to left. Reverse the collected columns to display it in sequence order.
The score table and the traceback path describe the same alignment. Its column scores must sum to the final cell score.
Our worked example: SEND and AND
x → S E N D
y ↓ A N D
These are short protein sequences, written with one-letter amino-acid codes.
Scoring matrix: BLOSUM62.
Linear gap cost: 8 per gap character.
A 4×5 score grid includes the empty-prefix row and column.
We will use these same inputs for global and local alignment.
Initialise the global grid
First cell: compare S with A
Second cell: a gap can be the best choice
Continue across the row, then down
Complete the global score grid
Trace back from the bottom-right cell
Recover the alignment and check its score
Ties mean more than one best route
A score cell can have two or three equally good predecessors.
For SEND / AND with BLOSUM62 and d=8, F(2,1) has a tie:
max{−8+1,1−8,−16−8}=−7.
Both diagonal and up are optimal ways to reach this cell.
A tie in a cell does not necessarily create multiple optimal complete alignments: the final traceback may never visit that cell.
The interactive grid shows every tied arrow. Its demonstration follows diagonal, then up, then left when tied.
Laboratory: change the gap cost
Local alignment: find the strongest matching region
Keep SEND / AND, BLOSUM62 and the gap cost of 8. Change only the alignment objective.
Global: Needleman–Wunsch
Local: Smith–Waterman
Align all residues
Align the best-scoring subsequences
SEND / A−ND
ND / ND
1−8+6+6=5
6+6=12
Local alignment can omit unfavourable flanking regions. It does not charge gaps for the omitted residues outside the selected subsequences.
Smith–Waterman: add a zero-score restart
The extra zero allows an alignment to start at the current position.
F(i,j)=max⎩⎨⎧0F(i−1,j−1)+s(xj,yi)F(i−1,j)−dF(i,j−1)−drestartalign the residuesgap in xgap in y
Initialise the first row and column to zero. Trace back from a highest-scoring cell anywhere and stop at zero.
Local alignment: see the zero restart
Fill the local grid
Trace back to zero
A longer protein example: explore both objectives
Global versus local: predict before computing
Decision
Needleman–Wunsch
Smith–Waterman
First row and column
Accumulated gap costs
Zero
Candidate moves
Diagonal, up, left
Diagonal, up, left, zero
Traceback starts
Bottom-right cell
A highest-scoring cell
Traceback stops
Origin
A zero-score cell
Predict: for W versus D, BLOSUM62 gives −4 and the gap cost is 8. What does each algorithm return?
Global: score −4, alignment W / D. Local: score 0, no positive-scoring alignment.
A high score under a scoring model is not yet evidence of homology — quantify it first (next section).
Statistical significance of a local score
For sufficiently long random sequences and an appropriate scoring model, optimal local-alignment scores follow an extreme-value law:
E=Kmne−λS
P=1−e−E≈E(small E)
m,n: sequence lengths; S: alignment score.
K,λ: calibrated by the scoring system and the residue background model — not from Smith–Waterman itself.
Illustrative E-values
With approximate BLOSUM62 constants K=0.13, λ=0.318, m=1000, n=100:
Score S
E-value
40
3.9 × 10⁻²
50
1.6 × 10⁻³
60
6.7 × 10⁻⁵
Every +10 in score divides the expected count of chance matches by ≈ 24.
The E-value is an expected count of chance matches, not the probability that an alignment is homologous.
Identity and similarity
Percent identity: identical residue pairs divided by the stated alignment-length denominator, multiplied by 100.
Percent similarity: residue pairs satisfying a specified similarity rule, often a positive substitution score, divided by the stated denominator.
State whether gaps are included and which scoring matrix defines similarity.
Worked example — SEND / A−ND: 3 identical residue pairs. Over all 4 alignment columns: 75% identity. Excluding the gap column: 100% of residue–residue columns. The denominator changes the number.
These percentages describe an alignment. Homology describes common ancestry.
BLAST
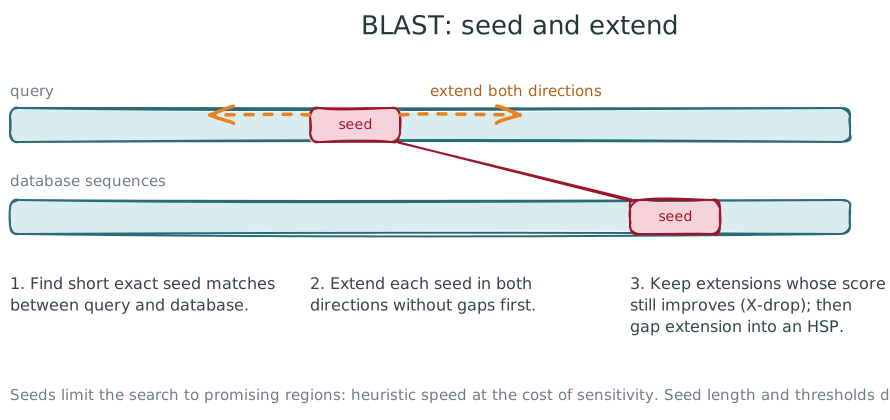
Heuristic search: seed and extend
BLAST — Altschul et al., 1990.
Finds short exact seed matches, extends them in both directions while the score improves, and keeps high-scoring segment pairs (HSPs) with bit scores and E-values.
Why not full dynamic programming?
Smith–Waterman needs O(nm) cells: a 1 000-residue query against a 10⁸-residue database ≈ 10¹¹ updates — infeasible.
Seeding limits the work to each seed’s neighbourhood, trading some sensitivity.
BLAST finds short exact seed matches between query and database, then extends them in both directions while the score keeps improving.
FASTA
FASTA
Pearson and Lipman, 1988: heuristic local alignment.
Uses a lookup table of short words (ktup: 2 for proteins, 6 for DNA by default) to find dense diagonals of similarity.
Rebuilds the top diagonals with gap-aware, optimized local alignment.
Higher ktup: faster, less sensitive; lower ktup: slower, more sensitive.
https://fasta.bioch.virginia.edu/ (redirects to HTTPS; verified 2026-10-01)
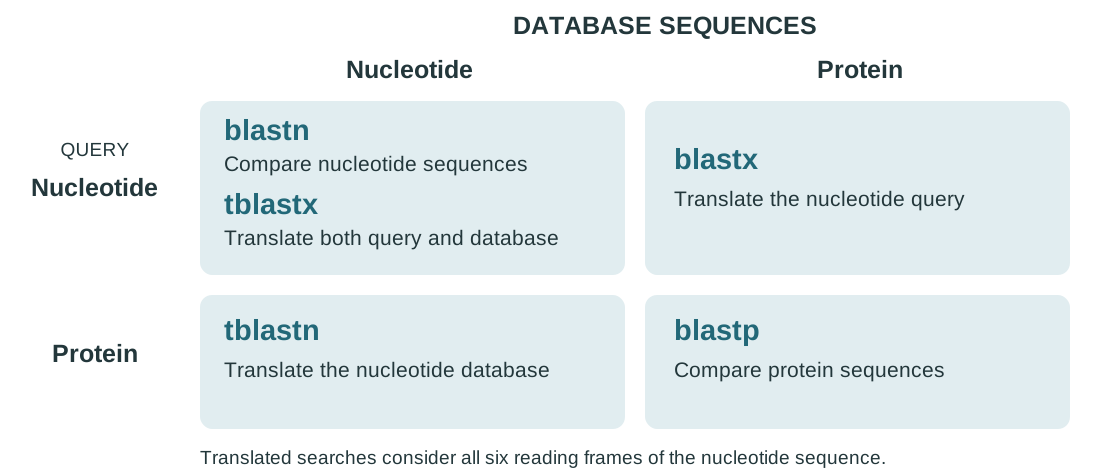
Choosing a sequence-search program
Multiple Alignment
Multiple Sequence Alignment
To align three or more biological sequences
We could think in an extension of dynamic programming methods for N individual sequences:
Involves the construction of an N-way or N-dimensional equivalent of the F matrix in a similar way than pairwise sequence alignment.
Not as computational efficient with large N. Combinatorial explosion as the number of sequences increases!!!
Methods have been published to reduce the search space of the algorithm.
Dynamic programming is used with limitations on MSA.
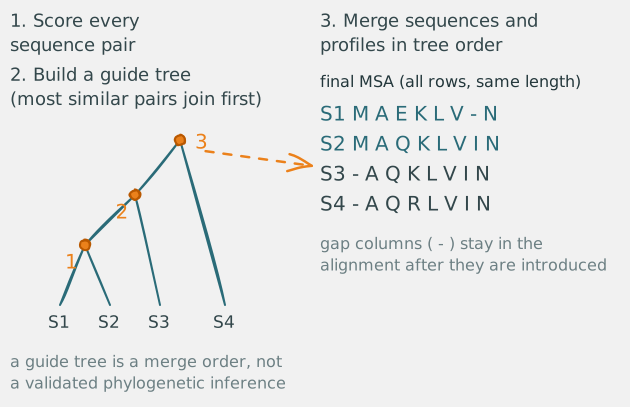
Progressive multiple alignment
Compute pairwise similarities or distances.
Build a guide tree or another ordering of the sequences.
Align sequences and profiles progressively in that order.
Early alignment errors can influence later steps.
A guide tree organises alignment; it is not automatically a validated phylogenetic inference.
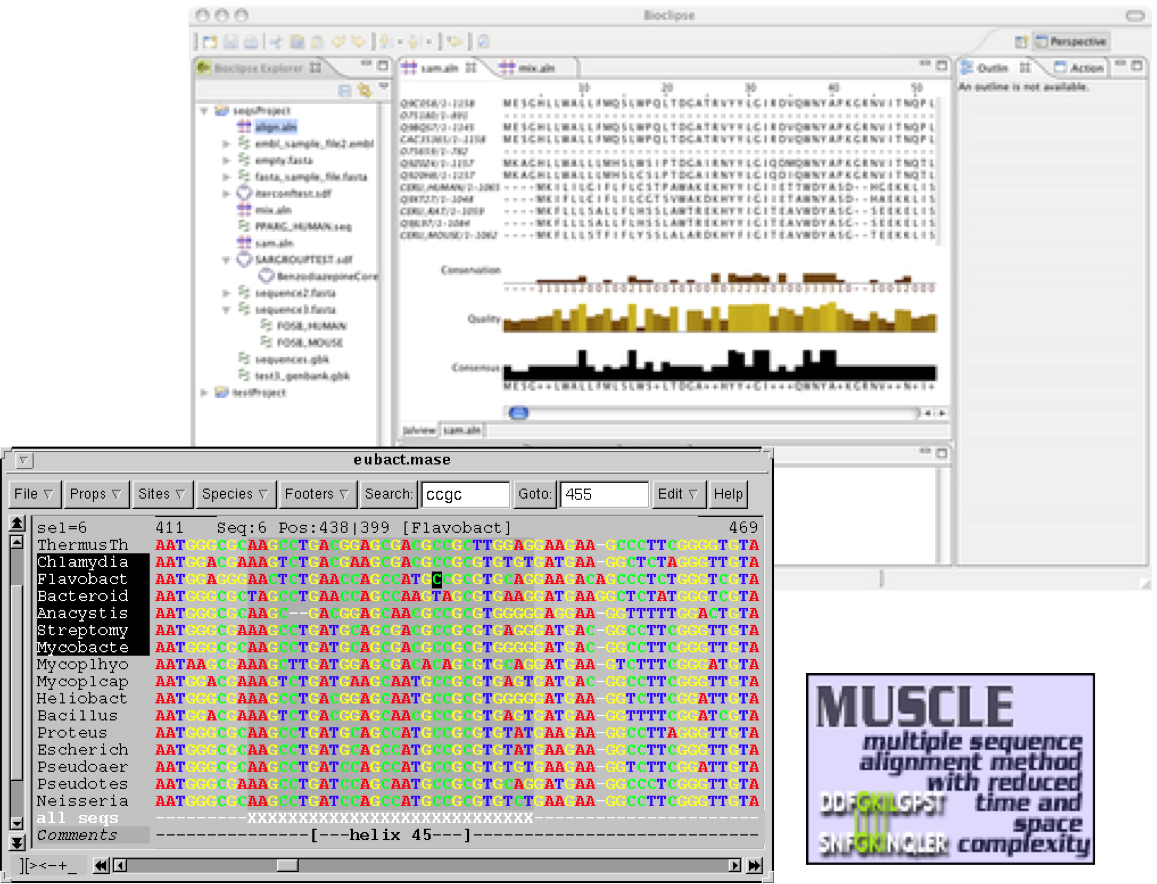
Multiple sequence alignment software
Alignment programs
MUSCLE, Clustal Omega, MAFFT
Kalign and T-Coffee
Viewers and editors
Jalview
SeaView
The screenshot illustrates the original course software comparison. Its entries and interfaces are historical.