The Human Genome Project and genome-wide association
Bioinformatics · Universitat Politècnica de Catalunya
From a genome sequence to a disease association
By the end, you should be able to calculate allele frequencies, distinguish heritability measures, choose a genotype model and explain why a GWAS hit is not automatically causal.
The Human Genome Project: what was achieved?
| Milestone | Contribution |
|---|---|
| 1990 | International public project launched |
| 2001 | Draft human genome analyses published |
| 2003 | Project completed: high-quality reference, with gaps remaining |
A shared coordinate system made it possible to connect sequence, genes, variation and phenotype. The reference was assembled from multiple donors; it was never a complete catalogue of human diversity.
After the reference: variation and biological function
| Project · landmark | Question | Contribution |
|---|---|---|
| HapMap · launched 2002 | Which variants travel together? | Common SNPs and haplotypes; a foundation for GWAS |
| 1000 Genomes / IGSR · Phase 3, 2015 | Which variants occur across populations? | 2,504 people, 26 populations; reference panels for variation and imputation |
| ENCODE · launched 2003 | Where are candidate functional elements? | Maps of transcription, chromatin and gene regulation across cell types |
Reference sequence → variation catalogue → biological interpretation.
Project names link to official resources. 1000 Genomes resource paper · ENCODE overview.
The 100,000 Genomes Project: bringing sequencing to patients
A clinical programme
- Announced in 2012; Genomics England established in 2013.
- 100,000 genomes milestone reached in December 2018.
- NHS participants affected by rare disease or cancer, with family members included.
What sequencing helps resolve
- Rare disease: compare relatives to identify inherited or new variants.
- Cancer: compare tumour and normal DNA to identify acquired variants.
- Helped establish the NHS Genomic Medicine Service.
100,000 genomes ≠ 100,000 people: one person can contribute tumour and normal samples.
From clinical sequencing to population-scale health research
| Project | Scale · dated milestone | Research purpose |
|---|---|---|
| UK Biobank | Whole genomes from ~500,000 participants, released in 2023 | Link genetic variation to health records, lifestyle, imaging and disease outcomes |
| All of Us · United States | >414,000 short-read genomes in the Research Hub FAQ, checked September 2026 | Study health and disease in a diverse cohort with linked health information |
More participants improve statistical power. Diverse recruitment and good phenotype data determine which questions we can answer.
UK Biobank: 500k release · All of Us: available genomic data. Individual-level data require authorised research access.
Completion and diversity are different goals
| Milestone | What it adds | What it does not mean |
|---|---|---|
| T2T-CHM13, 2022 | Gapless autosomes and X in this assembly | Every human genome, or a Y chromosome |
| Complete Y, 2023 | A resolved Y chromosome sequence | All Y-chromosome diversity |
| Draft pangenome, 2023 | 47 phased diploid assemblies | Exhaustive representation of humanity |
Later work includes HPRC Release II (2025). These are dated landmarks, not a latest-release inventory. Completeness and population representation remain distinct goals.
A reference is a coordinate system, not a “normal person”
- A variant is described relative to a reference sequence.
- Reference allele ≠ most frequent allele ≠ ancestral allele ≠ harmless allele.
- Record the assembly, chromosome, position and alleles; for transcripts, include accession and version.
- Different reference choices can change coordinates and variant representation.
Do not combine datasets until their builds and allele orientations have been checked.
Comparing genomes: always define the denominator
“Percent identical” depends on what is aligned and which differences count.
| Comparison | Questions to ask |
|---|---|
| Two human genomes | SNPs only, or also indels and structural variants? |
| Human and another species | Orthologous aligned sequence, genes, or whole genomes? |
| Gene counts | Which annotation release and gene definition? |
The source slide’s single percentages and fixed gene counts hid these choices. Genome similarity is not a ranking of biological complexity.
Karyotype: an ordered view of chromosomes
An ideogram
 Pairs ordered by size and banding; the 23rd pair is XX or XY.
A metaphase spread
 Chromosomes are photographed and classified.
Figures: National Human Genome Research Institute — public domain (credit “National Human Genome Research Institute”); G-banded karyogram via Wikimedia Commons.

Chromosomes organise and package DNA

Keep three terms separate
- Homologues: maternal and paternal versions of a chromosome.
- Sister chromatids: replicated copies of one chromosome.
- Centromere: region that supports chromosome segregation.
An X-shaped chromosome is replicated; not every chromosome looks like an X.
Figure: NIH/NHGRI.
The vocabulary of genetic variation
| Term | Meaning |
|---|---|
| Locus | A genomic position or region |
| Allele | One sequence version at a locus |
| Genotype | Allele combination carried by an individual |
| Haplotype | Alleles on the same physical chromosome copy |
| Allele frequency | Fraction of sampled chromosome copies carrying an allele |
| Prevalence | Fraction of people with a specified condition at a specified time |
Diploid autosomal examples have two copies per person. Ploidy can differ elsewhere.
Allele frequency is counted from chromosome copies
In 100 diploid people, observe 49 AA, 42 Aa and 9 aa.
p=f(A)=2(100)2(49)+42=0.70,q=f(a)=0.30.
| Quantity | Value |
|---|---|
| Frequency of allele a | 30% of chromosome copies |
| Frequency of genotype Aa | 42% of people |
| People carrying at least one a | 51% of people |
These are three different quantities. Counting alleles does not require Hardy–Weinberg equilibrium.
Hardy–Weinberg: from allele frequencies to genotypes
For two alleles, p+q=1.
Random union of gametes gives:
f(AA)=p2,f(Aa)=2pq,f(aa)=q2.
At p=0.7: 49%, 42%, 9%.
This is an expected distribution, not a claim that every population satisfies it.
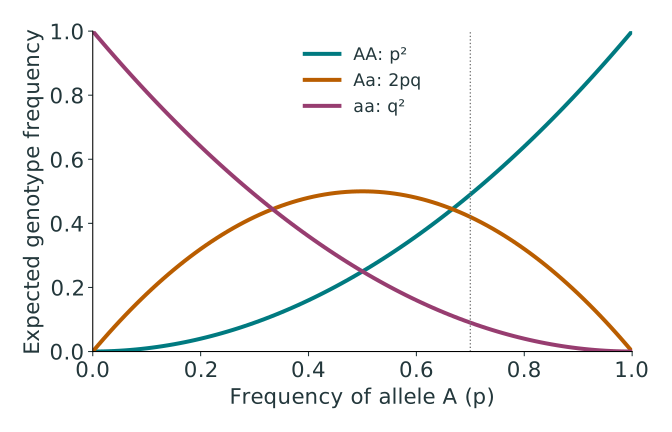
Figure: original plot of Hardy–Weinberg equations.
When Hardy–Weinberg expectations fail
| Possible reason | Interpretation |
|---|---|
| Genotyping error | A technical problem to investigate |
| Population mixture or inbreeding | Genotype proportions may depart from random mating |
| Selection or disease ascertainment | Particular genotypes may be overrepresented |
| Sampling variation | A test can reject by chance |
For case–control GWAS, HWE filtering is often assessed in controls. Choose thresholds for the study; do not treat every departure as an error.
Common disease can involve common and rare variants
The common disease–common variant hypothesis motivated early GWAS.
- Many common variants have small marginal effects.
- Rare variants can have large or small effects.
- A common disease can contain monogenic subtypes and a polygenic majority.
- Frequency and effect size do not determine each other by a universal rule.
Frequency, effect size and penetrance describe different properties.
Allele frequency and effect size shape discovery
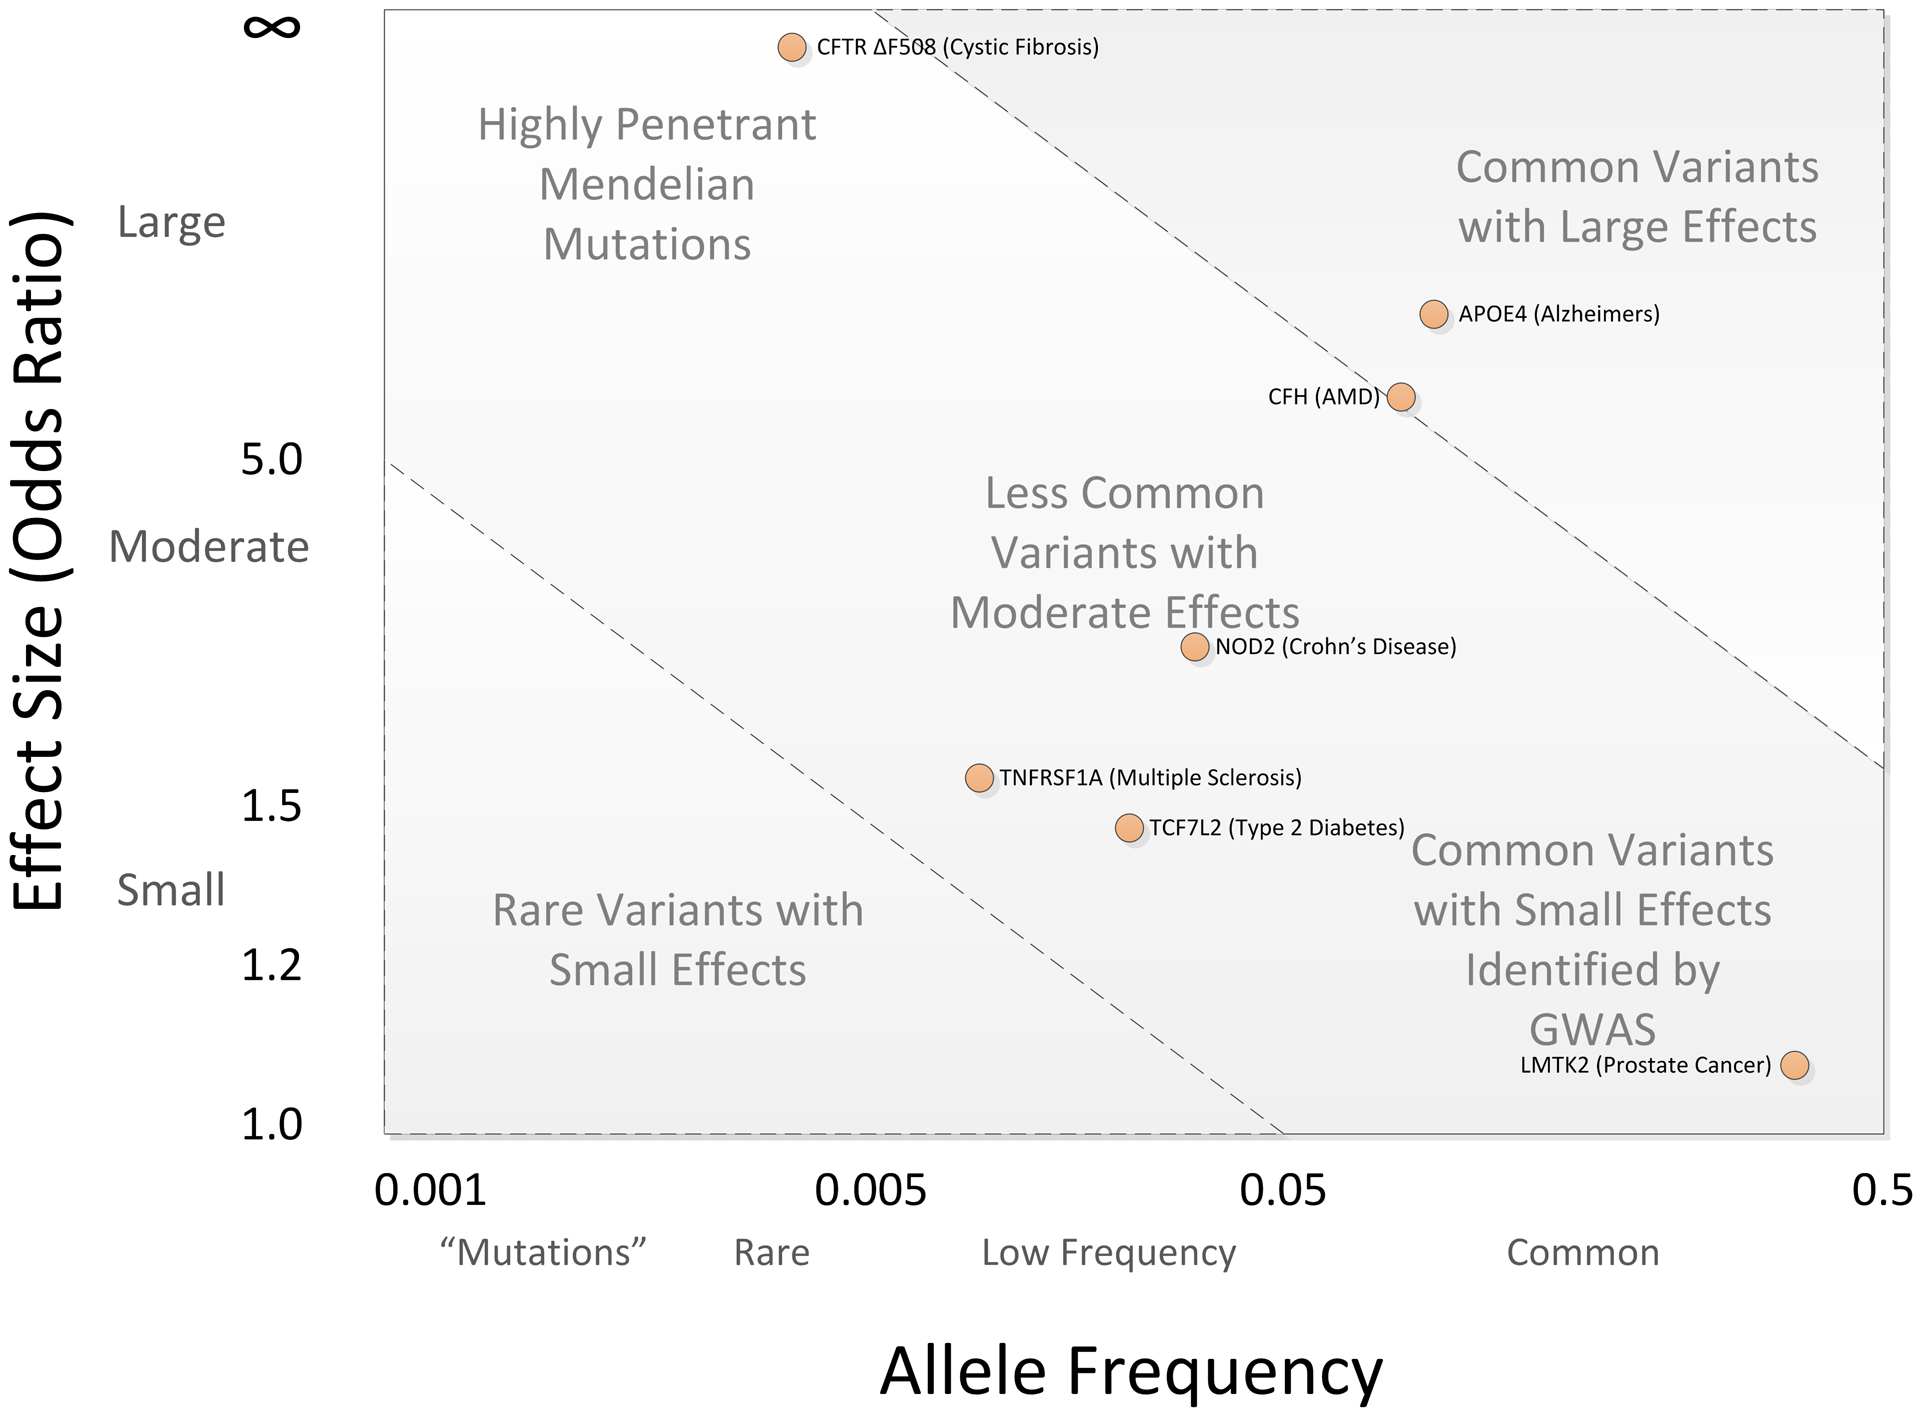
Read this as a conceptual map
- Rare, large-effect variants: family studies and sequencing can be informative.
- Common, small-effect variants: large association studies are often needed.
- Low frequency and small effect: especially difficult to detect.
What genome sequencing enables
- Locate and annotate genes and regulatory elements.
- Identify variants in Mendelian disease and complex-trait studies.
- Compare species and investigate evolutionary history.
- Design molecular assays and gene-editing experiments.
- Study gene expression, drug response and tumour evolution.
Sequence is a starting point: functional interpretation requires biological and clinical evidence.
Genetic architecture: four ideas that can coexist
How many loci?
Monogenic: one locus has a major role in a disorder.
Polygenic: many loci contribute to trait variation.
How do effects relate?
Pleiotropy: one genetic factor affects multiple traits.
Epistasis: the effect at one locus depends on genotype at another.
Monogenic disease does not mean identical outcomes
| Example | Key gene(s) | Important qualification |
|---|---|---|
| Cystic fibrosis | CFTR, chromosome 7 | Usually recessive; alleles and modifiers affect severity |
| Familial hypercholesterolaemia | Often LDLR, chromosome 19 | APOB, PCSK9 and other mechanisms also occur |
Penetrance, expressivity, environment and other genes can modify a monogenic condition.
Polygenic inheritance: many contributions
- Each locus can follow Mendelian transmission while the overall trait is complex.
- Height is quantitative; disease can be recorded as binary despite an underlying continuous liability.
- A bell-shaped trait distribution is a useful model in some settings, not a necessary consequence of “many genes”.
Pleiotropy: one genetic change, several consequences
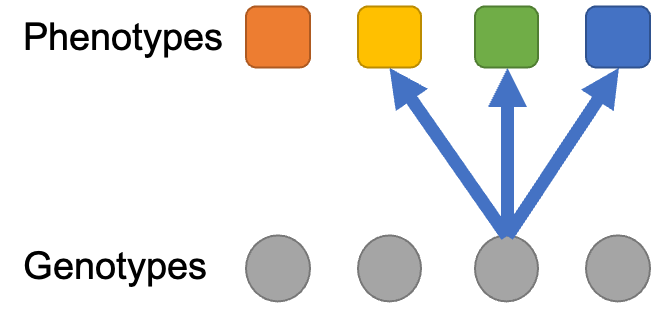
Example: haemoglobin S
A change in HBB can contribute to red-cell sickling, anaemia and downstream organ complications.
Multiple clinical consequences may share one upstream mechanism.
Statistical association with several traits can also reflect LD or mediated effects.
Figure: supplied lecture. Sickle cell disease, GeneReviews.
Epistasis: an effect depends on another locus
An interaction model can include:
Y=β0+β1G1+β2G2+γG1G2+ε.
- γ=0 means departure from additivity on this model’s scale.
- Biological pathway interaction and statistical interaction are not identical.
- Interaction estimates need adequate sample sizes and careful multiple-testing control.
A pathway can involve interacting proteins even when an additive statistical model predicts well.
Heritability describes variation in a population
H2=VPVGandh2=VPVA.
| Measure | Numerator |
|---|---|
| Broad-sense H2 | Total genetic variance VG |
| Narrow-sense h2 | Additive genetic variance VA |
Both use phenotypic variance in the denominator. Neither is the proportion of one person’s phenotype “caused by genes”.
Variance decomposition needs assumptions
Under a simplified model with uncorrelated components:
P=μ+A+D+I+E,VP=VA+VD+VI+VE.
- A: additive genetic effects; D: dominance; I: epistasis; E: residual environment and measurement.
- Correlations among components add covariance terms.
- Gene–environment interaction needs an explicit term; it cannot be added to the phenotype model and then omitted from its variance.
High heritability does not mean that an intervention cannot change the trait.
Kinship and relatedness are not the same coefficient
| Pair, assuming no inbreeding | Kinship ϕ | Additive relationship r=2ϕ |
|---|---|---|
| Individual with self | 1/2 | 1 |
| Parent–child or full siblings | 1/4 | 1/2 |
| Grandparent–grandchild; half siblings | 1/8 | 1/4 |
| Aunt/uncle–niece/nephew | 1/8 | 1/4 |
| First cousins | 1/16 | 1/8 |
Kinship is the probability that two sampled alleles are identical by descent. Shared environment and nonadditive effects prevent a general rule h2=correlation/r.
Association asks whether genotype and phenotype co-vary
A GWAS tests genetic variants across the genome for association with a phenotype.
A signal can arise from a causal variant, a correlated marker in LD, population structure, batch effects or chance.
A small p-value is evidence against a model’s null hypothesis—not proof of a causal gene or a large effect.
Study designs: binary, quantitative and molecular traits
| Phenotype | Example | Common starting model |
|---|---|---|
| Binary outcome | Cases versus controls | Logistic regression |
| Quantitative trait | Height, blood lipid concentration | Linear regression |
| Molecular trait | Gene expression or protein abundance | QTL model appropriate to the measurement |
Case–control sampling does not directly estimate population disease prevalence. An eQTL is associated with expression; it is not automatically a disease mechanism.
A GWAS workflow students can follow
Document genome build, allele coding, ancestry composition, sample overlap and each exclusion step. These choices are part of the analysis, not housekeeping.
Quality control protects the association test
| Samples | Variants |
|---|---|
| Missingness and contamination | Call rate and batch differences |
| Duplicates and relatedness | Allele alignment and strand ambiguity |
| Phenotype and covariate consistency | Allele counts/frequency |
| Population structure | HWE in an appropriate comparison group |
| Consent and permitted use | Imputation quality |
Thresholds depend on study design and data quality. Rare-variant tests require special attention to low counts.
Imputation predicts unobserved genotypes
- Phasing estimates which alleles share a chromosome copy.
- Imputation uses shared haplotype patterns to infer untyped variants.
- Dosage is an expected allele count between 0 and 2, not always an integer.
- Reference-panel match, allele frequency and local LD affect accuracy.
Use imputation quality and uncertainty in downstream analysis.
Quantitative-trait GWAS: one SNP plus covariates
Yi=β0+βGGi+γTCi+εi.
- Gi: 0, 1 or 2 copies of the chosen effect allele, or imputed dosage.
- Ci: covariates such as age, study batch and ancestry components.
- βG: mean trait change per additional effect allele under the additive model.
- Test H0:βG=0; report effect estimate, uncertainty and effect allele.
Changing which allele is counted reverses the sign of the estimated effect.
Binary-trait GWAS: log odds, not the phenotype itself
log1−Pr(Yi=1)Pr(Yi=1)=β0+βGGi+γTCi.
Odds ratio per allele=eβG.
An odds ratio is not an absolute risk and is not generally a risk ratio. Baseline risk and ascertainment matter. Very low allele counts or separation may require Firth or other suitable methods.
Genotype coding defines the question
| Model for allele a | AA | Aa | aa | SNP degrees of freedom |
|---|---|---|---|---|
| Additive dosage | 0 | 1 | 2 | 1 |
| Dominant | 0 | 1 | 1 | 1 |
| Recessive | 0 | 0 | 1 | 1 |
| Genotypic | baseline | indicator 1 | indicator 2 | 2 |
“Dominant” and “recessive” here describe a fitted contrast for a chosen allele; they are not established modes of disease inheritance.
Four genotype models, four patterns

Compare the mean at Aa with the means at AA and aa. Curves are illustrative, not patient results.
Figure: original schematic plots; axes and allele coding explicitly labelled.
A two-degree-of-freedom test allows a separate heterozygote effect
Yi=β0+β11(Gi=1)+β21(Gi=2)+γTCi+εi.
Joint null: H0:β1=β2=0.
- No requirement that the heterozygote mean lies halfway between homozygotes.
- More flexibility, but usually less power than a correctly specified one-df model.
- For a binary trait, apply this linear predictor to the logit, not directly to a 0/1 response.
Why genome-wide significance is stringent
One million tests at a nominal p<0.05 would yield about 50,000 false positives under the global null.
αBonferroni=1060.05=5×10⁻⁸.
This is a conventional common-variant GWAS benchmark. LD makes tests correlated; sequencing, ancestry, variant sets and multiple phenotypes can require different corrections.
A discovery still needs replication and a credible analysis.
Reading a Manhattan plot
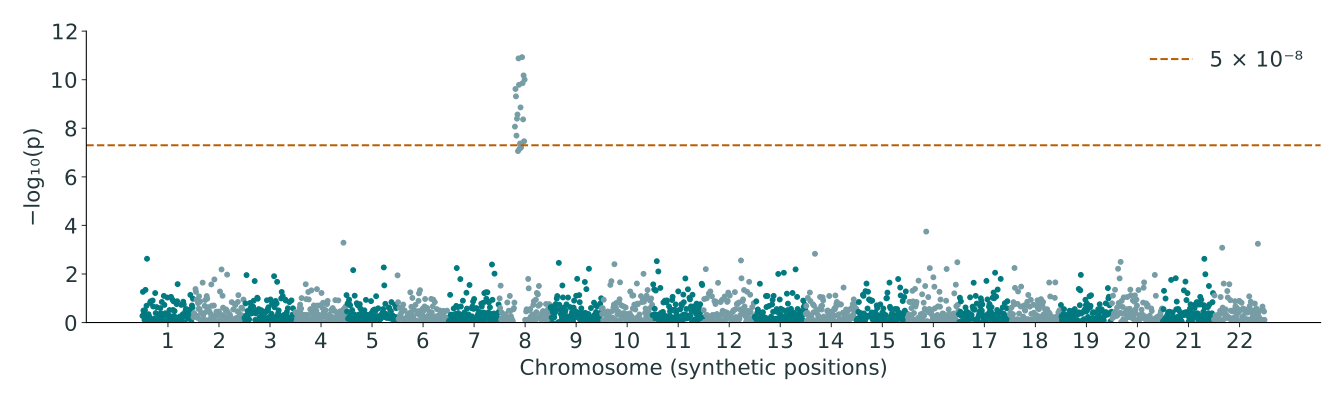
Each dot is a variant. A cluster can reflect many correlated markers tagging one signal.
Figure: reproducible synthetic data, generated for teaching; not a real disease GWAS.
Population structure can mimic genetic association
Suppose ancestry groups differ in allele frequency and disease prevalence for environmental or sampling reasons.
A pooled genotype–disease association can then appear without a causal allele effect.
- Inspect ancestry structure, phenotype distribution and study batches.
- Include appropriate covariates and consider mixed models.
- Genetic ancestry is a statistical description, not a substitute for social or environmental variables.
Relatedness is a separate modelling problem
Relatives share alleles across the genome, so their residuals may be correlated.
Y=Xβ+u+ε,u∼N(0,σg2K).
K represents genetic similarity. Mixed models can account for relatedness and sample structure; binary outcomes need appropriate extensions.
Family-based designs can also be deliberately used for robust within-family inference. They are not inherently flawed GWAS designs.
Linkage disequilibrium is correlation across loci
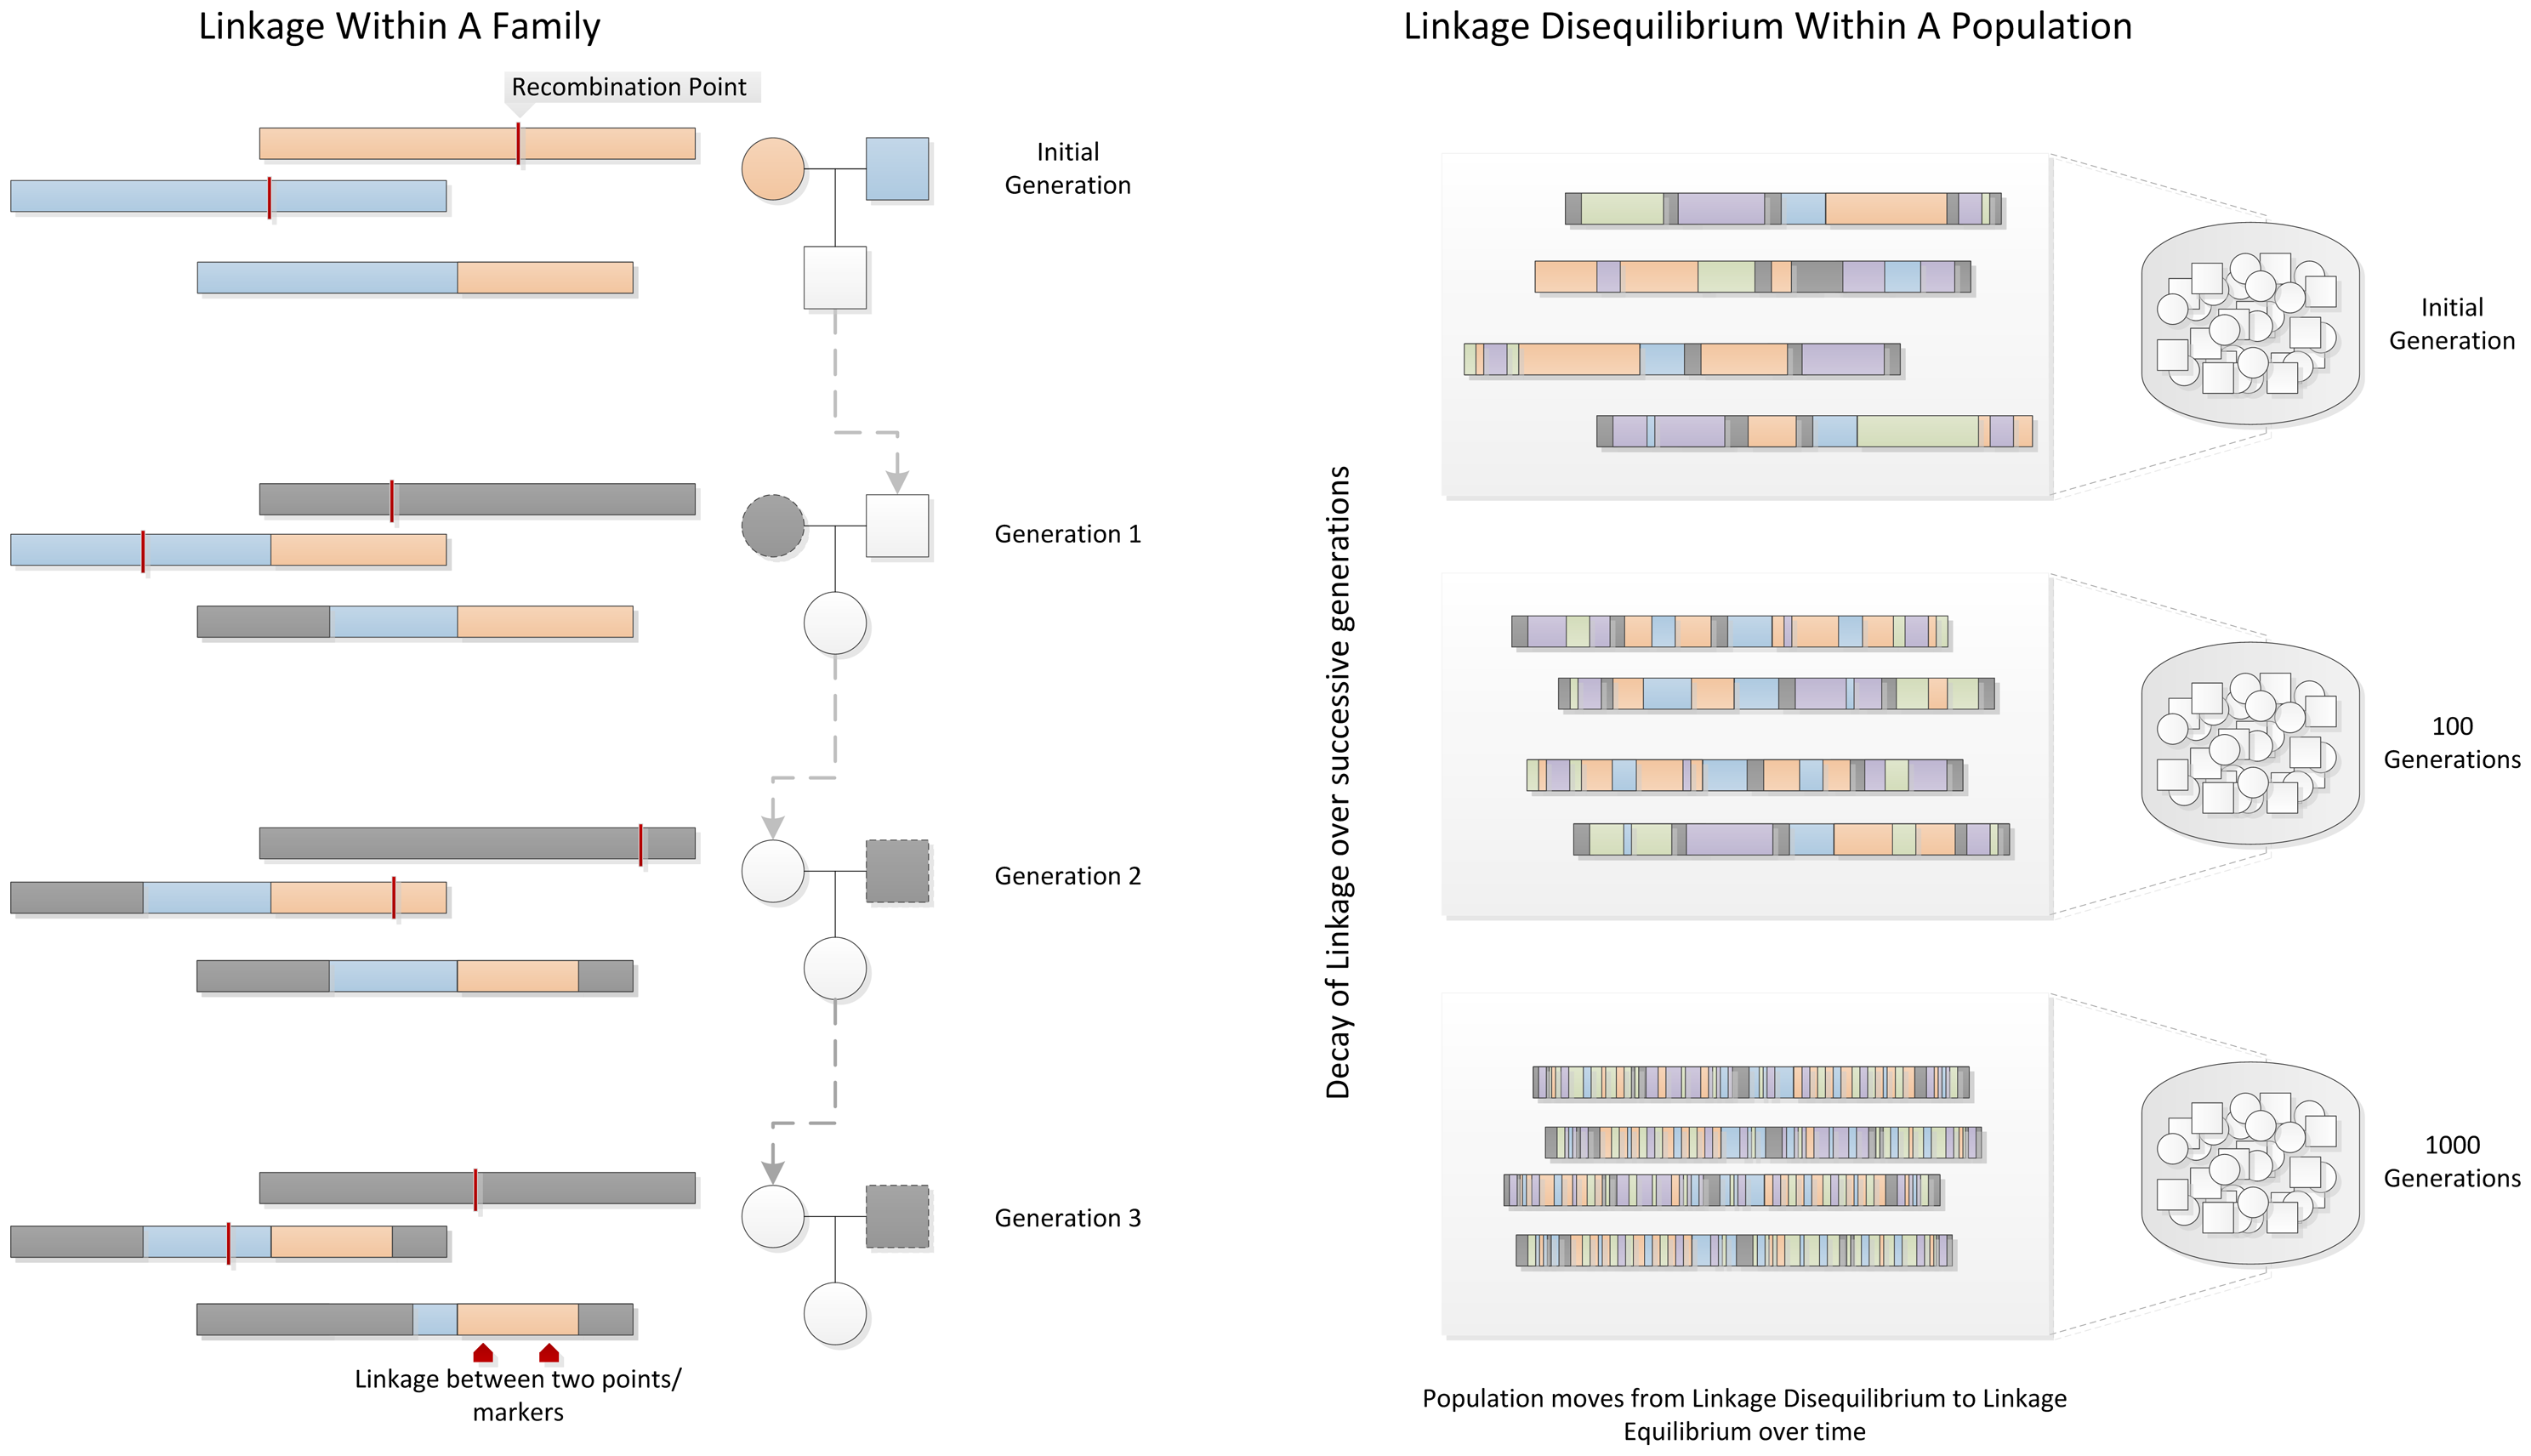
Distinguish the concepts
Linkage: nearby loci tend to cosegregate in families.
LD: alleles at different loci occur together non-randomly in a population.
Recombination, demography and selection shape LD.
A genotyped marker can tag an unobserved causal variant
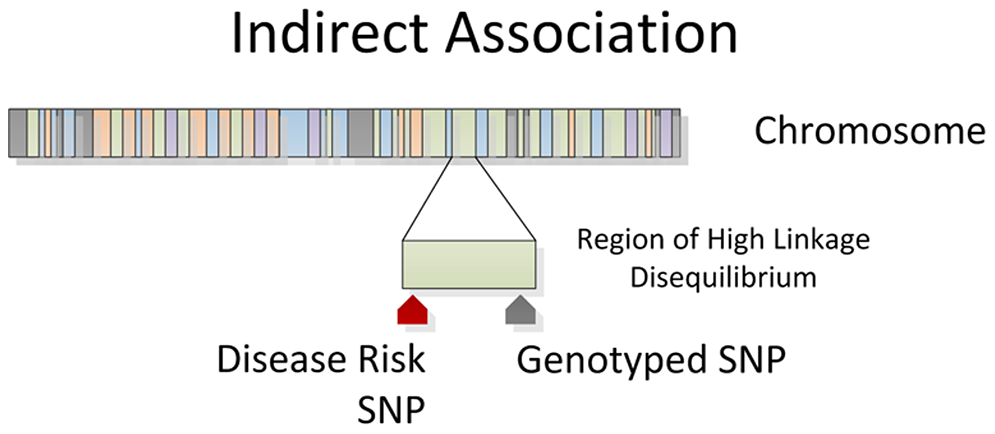
A hit identifies a region to investigate
- A lead SNP can be a proxy.
- LD patterns differ between populations.
- The closest gene is not automatically causal.
- Fine-mapping and functional evidence help distinguish alternatives.
A small numerical example of LD
For alleles A and B at two loci:
D=f(AB)−pApB,r2=pA(1−pA)pB(1−pB)D2.
If pA=pB=0.5 and f(AB)=0.4, then D=0.15 and r2=0.36.
If haplotypes AB and ab each have frequency 0.5, r2=1: perfect tagging in that population. If the loci are independent, D=0.
Discovery and prediction use different strategies
Single-variant GWAS usually tests one marker at a time, adjusting for covariates.
A joint predictive model instead combines many markers:
Y=β0+j=1∑mβjGj.
There are 2m possible subsets of m markers. Exhaustive subset search quickly becomes infeasible; LD also makes coefficients difficult to estimate without suitable constraints.
Pairwise interactions grow quadratically
For distinct unordered pairs among m markers:
Number of pairs=(2m)=2m(m−1).
For m=1,000, this gives 499,500 interaction terms, in addition to main effects.
Use ∑j<kγjkGjGk to count each pair once. The source expression m!/(m−2)! counted each pair twice.
Predictive modelling: fit, tune, then evaluate
| Approach | Main idea |
|---|---|
| Ridge / Bayesian shrinkage | Stabilise many small, correlated effects |
| LASSO / elastic net | Shrink coefficients, possibly selecting a subset |
| Trees, boosting, neural networks | Model flexible patterns; need careful validation |
| Biological priors / pathway models | Use external knowledge without assuming it proves causality |
Keep relatives and overlapping samples from leaking across evaluation splits. Tune in training data; report performance in independent data.
Polygenic scores are not individual destinies
PGSi=j∑βjGij.
- Score performance depends on discovery sample size, LD, ancestry, phenotype and environment.
- Evaluate discrimination and calibration in the intended population.
- A score is not an absolute risk without an appropriate risk model.
- Clinical benefit and fairness require evidence beyond association significance.
“Missing heritability”: which gap are we discussing?
| Quantity | What contributes? |
|---|---|
| Significant-hit variance explained | Variants that pass a chosen discovery threshold |
| SNP-based heritability | Additive effects tagged by the analysed variant set |
| Pedigree-based estimate | Familial resemblance under a specified model |
These need not agree. Many effects are too small to pass single-variant significance, even when their combined contribution can be estimated.
Why estimates and prediction can differ
- Rare or structural variants may be poorly tagged by the analysed markers.
- Many weak associations lie below the discovery threshold.
- Phenotype noise and environmental differences change what is estimated.
- Family models can be affected by shared environment and their assumptions.
- Nonadditive effects and gene–environment interactions can matter, depending on the trait.
Do not label all unexplained variance “missing genetic effects”.
From a GWAS hit to a biological explanation
Replication checks whether the association survives another sample. Colocalisation can test whether two signals may share a causal variant. Experiments can test a proposed mechanism.
Each step adds evidence; none should be silently replaced by “nearest gene”.
The central ideas to take away
- Reference genomes provide coordinates; human variation is broader than one reference.
- Allele frequency, genotype frequency and prevalence are different quantities.
- Heritability is a population-specific variance ratio.
- GWAS tests association; LD and confounding shape its signals.
- Good inference needs quality control, appropriate models, replication and honest uncertainty.
Key readings and teaching sources
Questions


Bioinformatics · UPC · b2slab