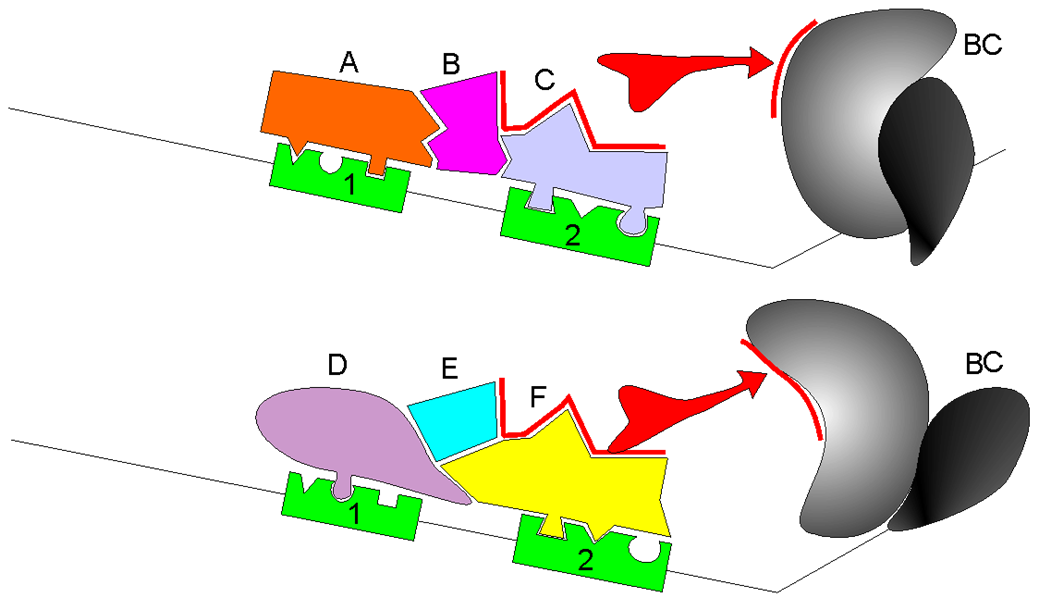
The spliceosome recognises splice sites and a branch point in the pre-mRNA.
The intron forms a lariat intermediate; the adjacent exons are ligated.
Regulatory proteins and RNA sequence/structure influence which sites are used.
Most major-spliceosome introns have GU…AG boundaries in RNA; these two dinucleotides alone do not define a splice site.
Alternative splicing changes the RNA product without changing the genomic DNA.
RNA splicing in three dimensions
Accessible teaching summary
A pre-mRNA contains exon segments separated by an intron. Spliceosome components recognise RNA signals and bring the reacting sites together. The intron forms a lariat, the exon ends are joined, and the intron is released. The mature RNA can include untranslated as well as protein-coding sequence. Alternative choices of splice sites can produce other RNA isoforms.
Authored equivalent of the teaching content; not a verbatim transcript.
Watch for this
How do the exon ends meet while the intron is removed?
The film simplifies exons as coding sequence. Remember that exons also include UTRs.
Then explain
Explain which molecular interaction makes this step selective.
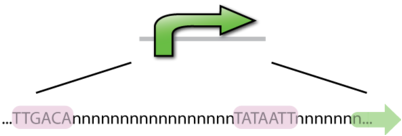
A promoter helps recruit the machinery that initiates transcription.
Initiation depends on regulatory proteins, DNA context and, in eukaryotes, chromatin.
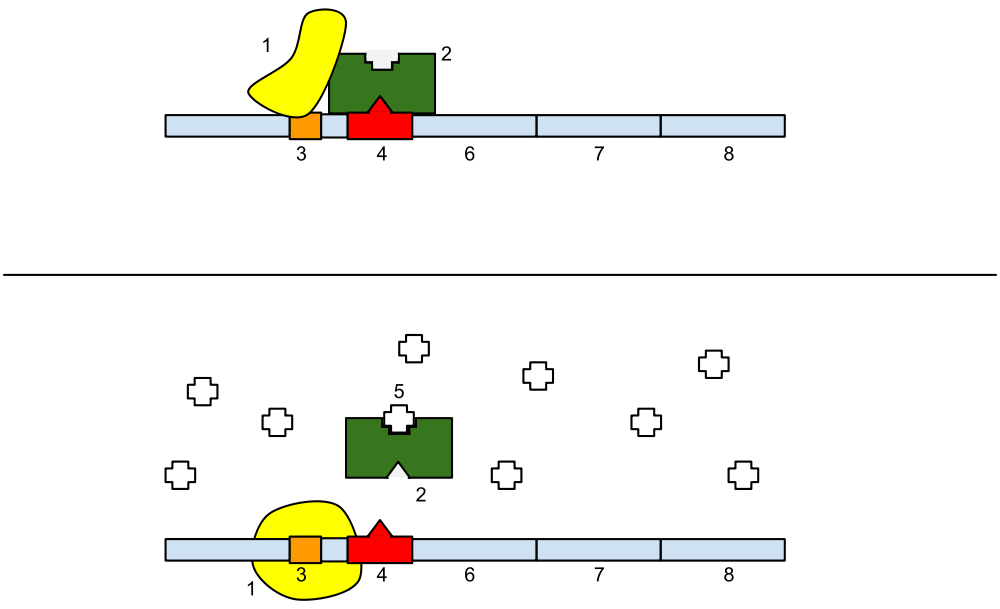
In bacterial operons, an operator is a regulatory protein-binding site.
Eukaryotic enhancers can act at a distance; they are not simply bacterial operators.
Promoter and regulatory protein binding
The lac operon: a bacterial example
lacZ encodes β-galactosidase, not lactase.
LacI represses transcription by binding the operator.
Allolactose, derived from lactose, reduces repressor binding.
Strong expression also depends on glucose availability through cAMP–CAP.
The figure simplifies induction by showing lactose.
Promoter Choice
A gene may have multiple promoters and transcription start sites.
Different promoters can produce different first exons or 5′ UTRs.
Coding sequences may also differ, depending on transcript structure.
Alternative promoter use and alternative splicing are distinct mechanisms that can occur together.
Image from Kel A.E., Ratner V.A.
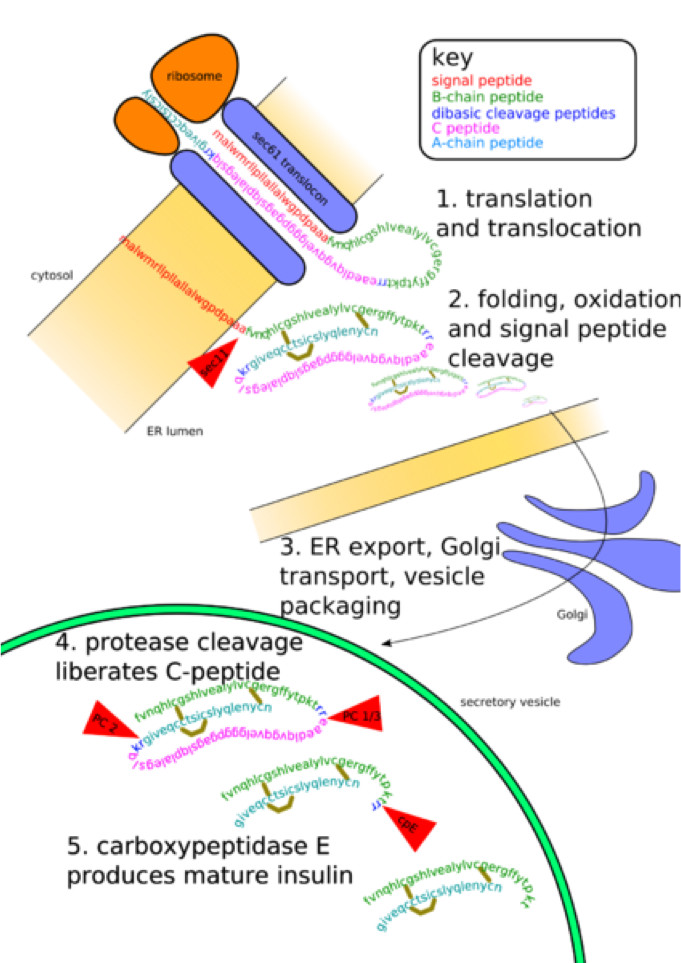
Post Translational Modifications
Posttranslational modification (PTM) is the chemical modification of a protein after its translation.
PTM extends the range of functions of a protein:
Attaching to it other biochemical functional groups.
Changing the chemical nature of an amino acid (e.g. citrullination).
Making structural changes, like the formation of disulfide bridges.
Removing amino acids from the amino end of the protein
Cutting the peptide chain in the middle.
The proteome
The proteome is the set of proteins present in a biological system under specified conditions.
Proteins have structural, catalytic, transport, regulatory, and immune roles. Protein abundance and modification depend on cell type and state.
Some genes produce functional RNAs rather than proteins.
What are we actually measuring?
Biological quantity
A suitable measurement
Main caution
RNA abundance
Microarray or RNA-seq
Not a direct protein measurement
Protein abundance
Mass spectrometry or immunoassay
Isoforms and detection biases matter
Protein activity
Functional assay
Abundance alone is insufficient
RNA abundance reflects both synthesis and degradation.
Translation and protein turnover further separate RNA and protein levels.
Measuring mRNA abundance
Expression microarrays estimate the abundance of selected RNA targets. They do not directly measure protein abundance or post-translational modifications.
How do DNA arrays work?
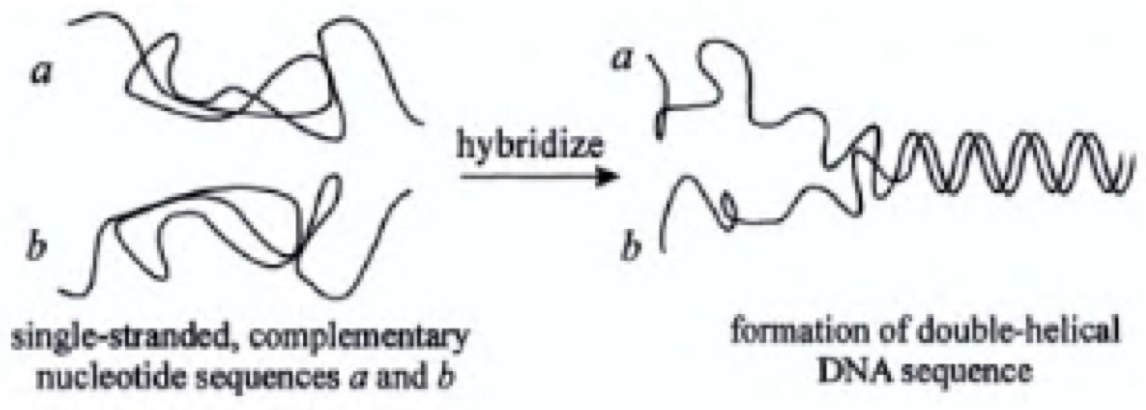
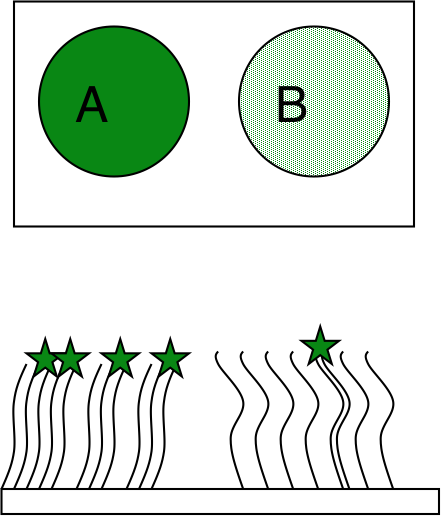
Hybridization
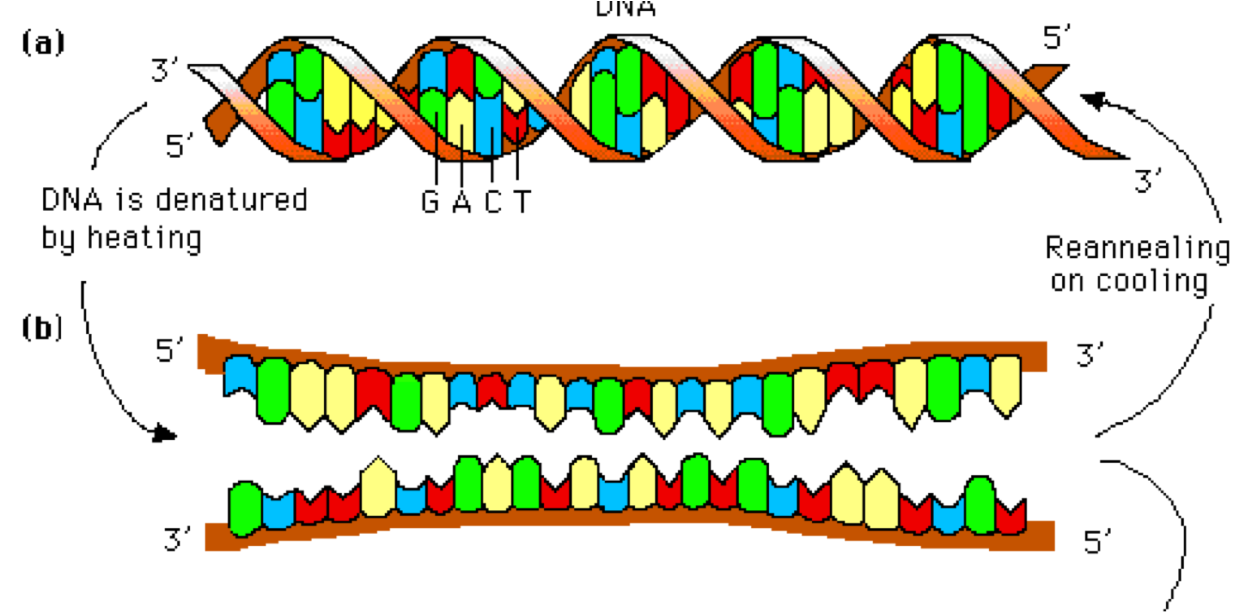
Complementary single-stranded DNA or RNA molecules associate through base pairing to form a duplex.
Yield
Depends on:
The concentration of the original single-stranded polymers,
Sequence complementarity, temperature, salt concentration and time.
DNA Hybridization
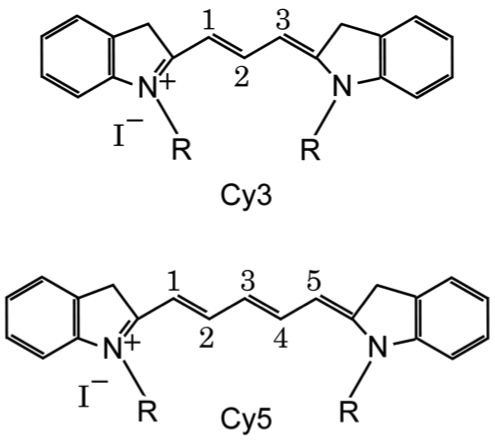
Fluorescent labels turn binding into a signal
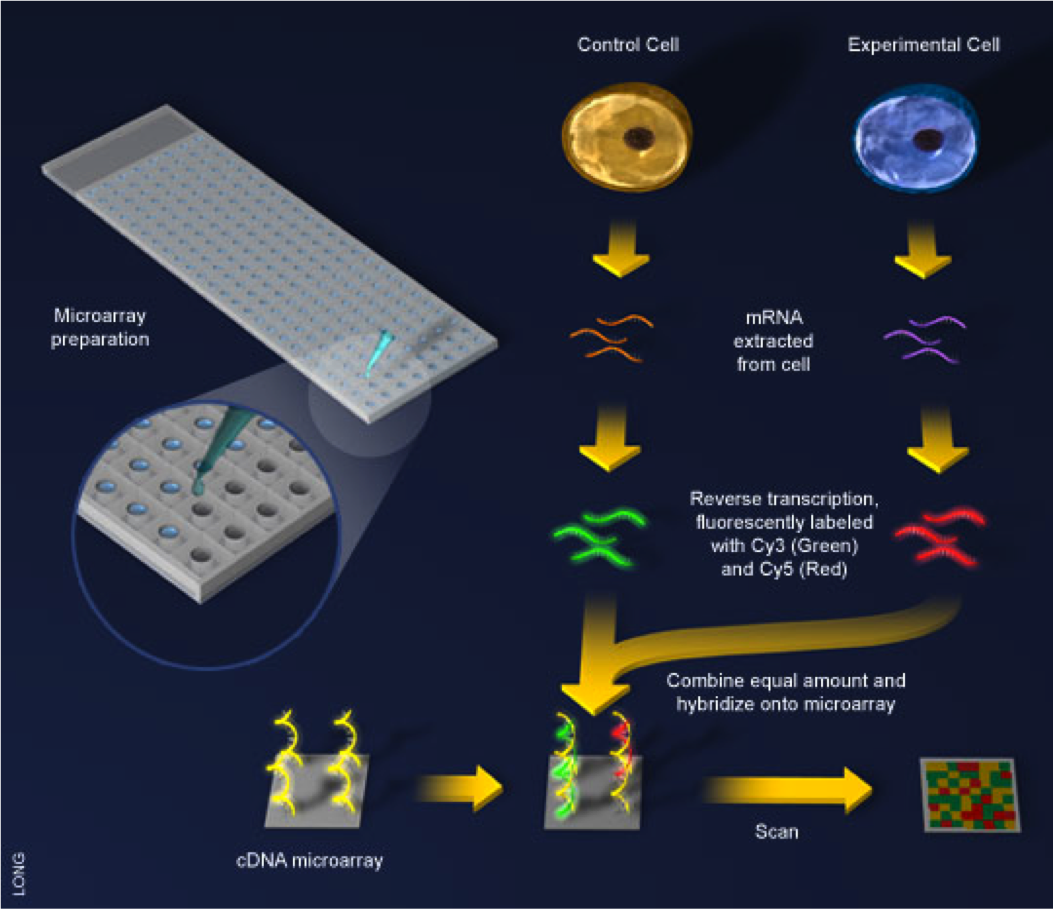
Two-colour arrays
Label one sample with Cy3 and the other with Cy5.
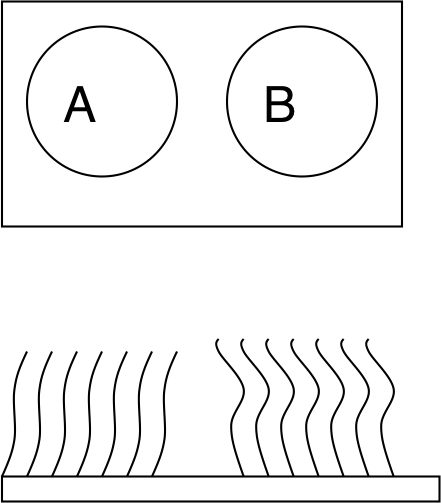
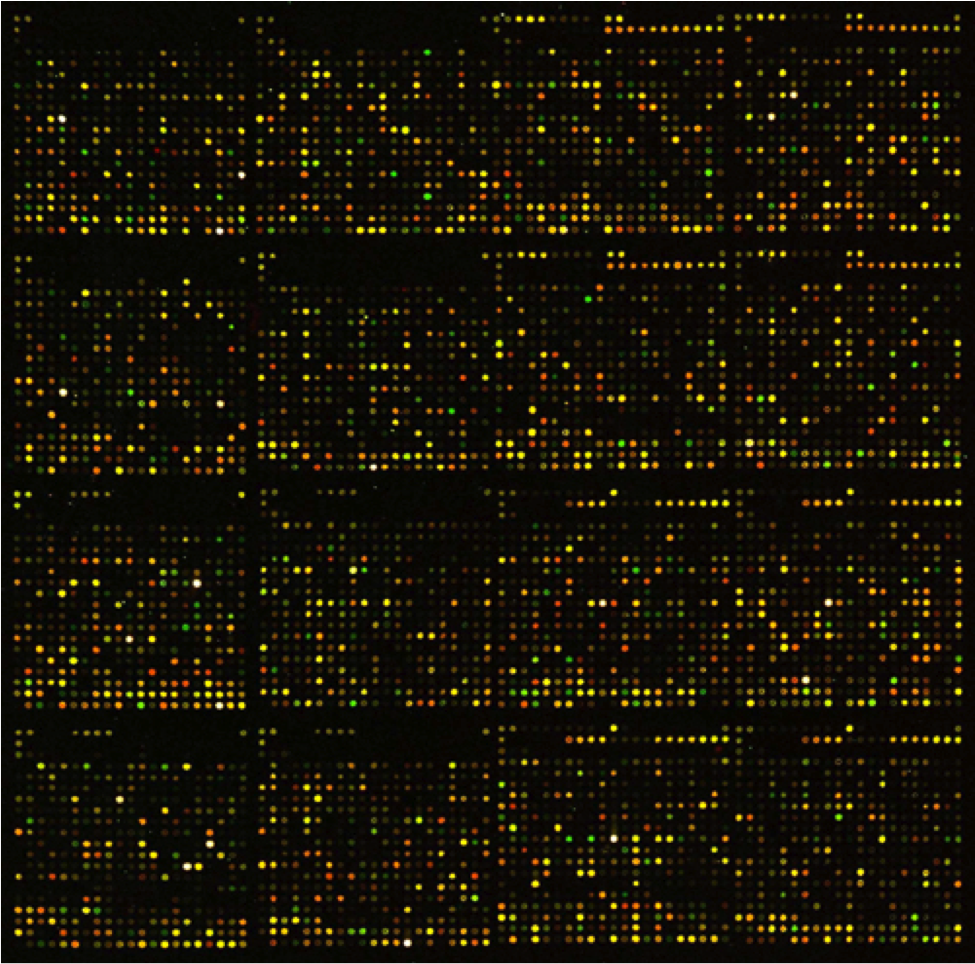
Hybridise both to the same array; scan the channels separately.
A brighter raw spot on array B is not enough to conclude higher expression. Processing and replicate variation matter.
How are the probes put on a chip?
Manufacturing approach
How probes are made
Main idea
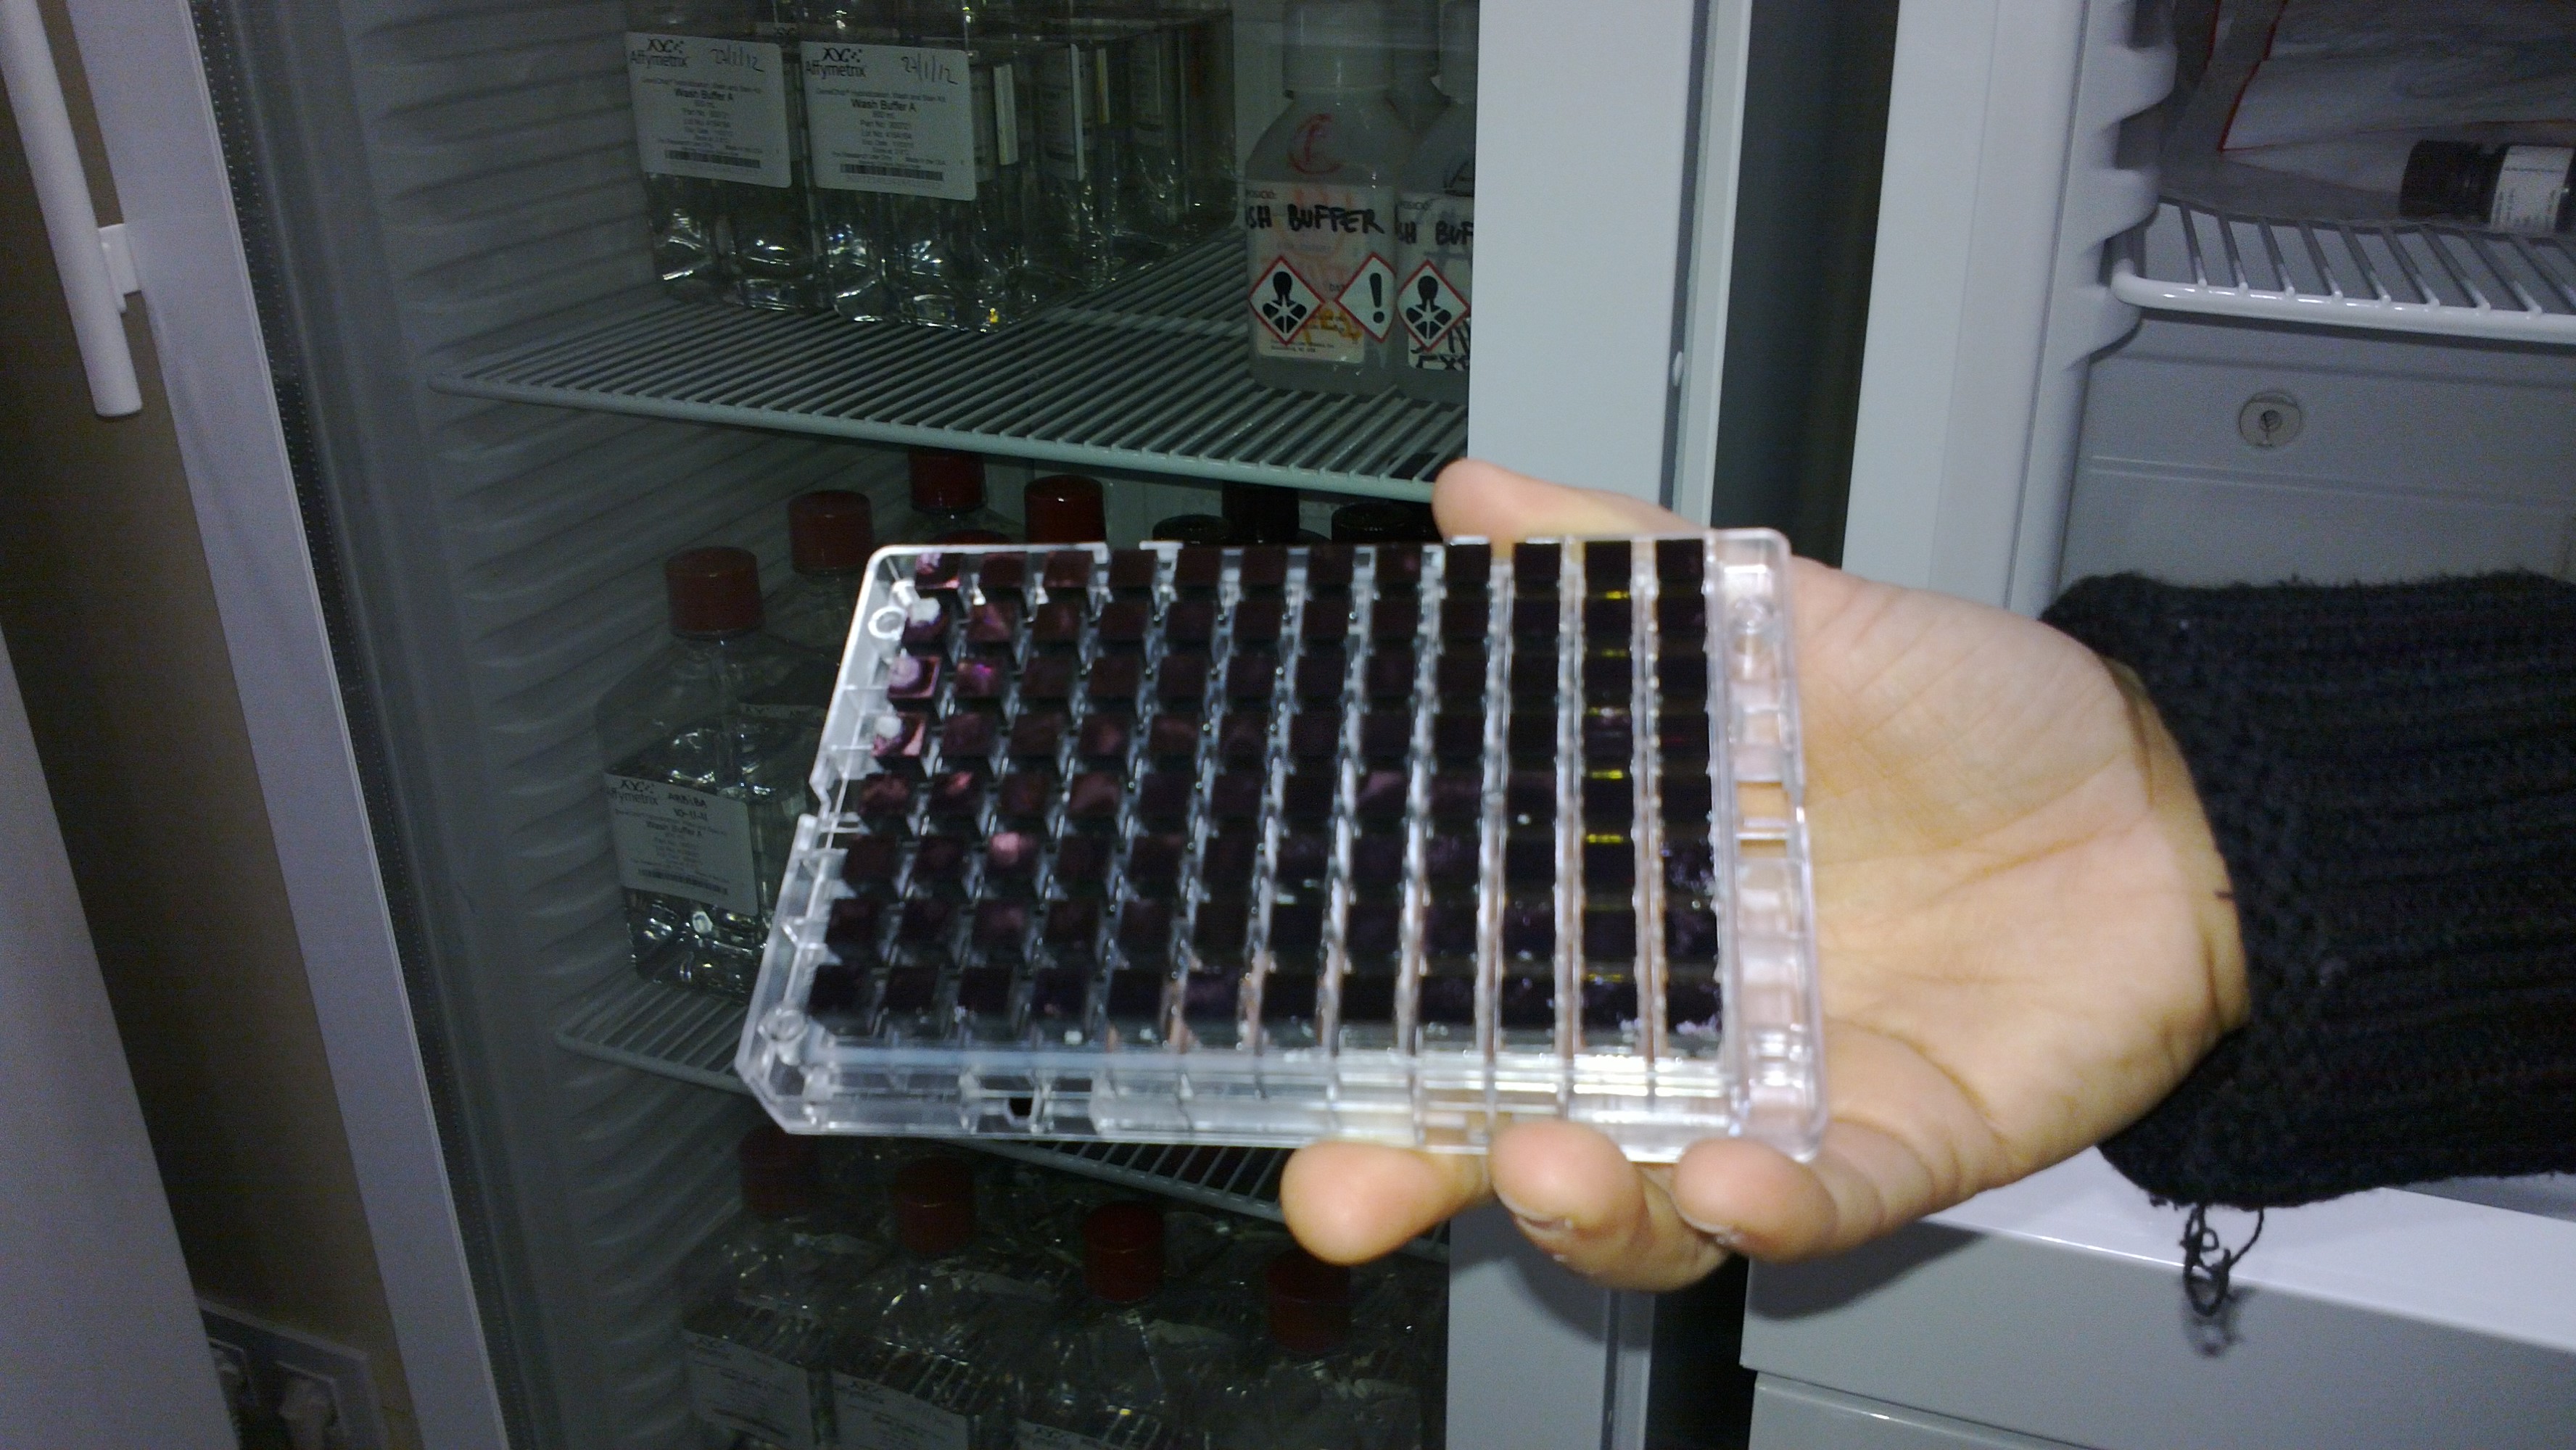
Spotted arrays
Prepare DNA/oligos, then deposit them
Place existing probes at chosen positions
Light-directed in situ synthesis
Add bases on the surface using patterned light
Light selects which features can grow
Inkjet in situ synthesis
Deliver reagents to selected positions
Local reagent delivery selects growth
A feature contains many copies of a designed probe sequence.
The next slides explain classical light-directed synthesis.
Light selects where the next base is added
Protected surface → patterned light removes selected protecting groups → one protected nucleotide couples at those sites → wash → repeat with other masks and bases. Each feature builds many identical probes; different features follow different growth schedules.
Probe synthesis: sequence space versus manufacturing cycles
Probe length N
Possible sequences: 4ᴺ
Base-specific cycles: at most 4N*
1
4
4
2
16
8
3
64
12
10
1,048,576
40
25
1,125,899,906,842,624
100
Parallel synthesis saves cycles; it does not create unlimited chip area.
*Idealised A/C/G/T schedule at each position. A cycle includes exposure, coupling and washing; actual chemistry has additional steps. Only the selected probe designs fit on the chip.
Watch a GeneChip being built
Accessible teaching summary
A glass surface carries linkers with light-sensitive protecting groups. Patterned light removes protection only at selected features. A protected nucleotide reagent contacts the surface and couples at those exposed ends. Washing removes excess reagent. Repeating different light patterns and base additions builds many copies of each designed probe in parallel. Light provides spatial selectivity; this is chemical synthesis rather than polymerase copying.
Authored equivalent of the teaching content; not a verbatim transcript.
Watch for this
Which step provides spatial selectivity: the light pattern or the nucleotide reagent?
Why can many different probes grow in parallel?
Then explain
Explain which molecular interaction makes this step selective.
Microarrays: powerful, but constrained by their probes
You mainly measure sequences represented by the probe design.
Related sequences may cross-hybridise.
Background and saturation limit the usable signal range.
Transcript isoforms are distinguishable only if the probes target informative regions or junctions.
Transition: can we read sample-derived sequences instead of measuring binding to a fixed probe set?
RNA-seq: sample RNA, read DNA, infer expression
Biological material
RNA molecules in the sample
Sequencing material
A library of RNA-derived DNA fragments
Observed data
Sequence reads and quality scores
In conventional short-read RNA-seq, reverse transcription makes cDNA. The sequencer reads DNA; analysis relates those reads back to RNA abundance and structure.
Direct RNA sequencing is a different technology.
Before the flow cell: what does PCR do?
The ingredients
A DNA template
Two primers that flank a target
A thermostable DNA polymerase
dNTPs, buffer and suitable ions
The principle
Separate the DNA strands.
Let primers bind complementary sites.
Extend from each primer’s 3′ end.
New DNA is always synthesised 5′ → 3′.
Reverse transcription makes cDNA; PCR amplifies DNA.
PCR: predict the next step
Denature (~95 °C) → anneal primers (~50–65 °C) → extend (~72 °C for Taq). Repeat. One ideal double-stranded template becomes 2, 4, 8… copies. Exact temperatures and efficiency depend on the protocol.
PCR in motion
Accessible teaching summary
Heating separates a DNA duplex without breaking its backbones. Cooling allows two primers to bind opposite template strands, with their extendable 3′ ends pointing towards the target. DNA polymerase adds nucleotides to these ends, synthesising new strands 5′ to 3′. Repeated separation, primer binding and extension ideally doubles the DNA each cycle. Real reactions have less than perfect efficiency, and early products need not have both final target boundaries.
Authored equivalent of the teaching content; not a verbatim transcript.
Watch for this
Locate the primers. Which ends can the polymerase extend?
Why is one primer not sufficient for ordinary exponential PCR?
Then explain
Explain which molecular interaction makes this step selective.
Amplification creates copies—and can introduce bias
Completed cycles
Ideal copies from one template
0
1
1
2
3
8
10
1,024
20
1,048,576
The ideal model is 2ⁿ. Real reactions have variable efficiency and eventually plateau.
Copies from one molecule are not independent biological replicates. Sequence-dependent amplification can distort representation.
RNA-seq starts with an experimental design
Define the contrast: tissue, condition, time point or treatment.
Collect independent biological replicates; technical repeats answer a different question.
Balance conditions across extraction, library preparation and sequencing batches.
Assess RNA quality and choose a protocol suited to the material.
A perfect sequencer cannot rescue a confounded experiment.
Which RNA population will enter the library?
Strategy
What is enriched or retained?
Important consequence
Poly(A) selection
Polyadenylated RNA, mainly eukaryotic mRNA
Misses many non-polyadenylated RNAs
rRNA depletion
RNA remaining after removing targeted rRNAs
Can include non-coding RNA and pre-mRNA
Targeted capture
Selected transcripts/regions
Limited by the target design
Choose for the organism, RNA integrity and biological question.
The library is a selected representation of the RNA sample.
Build a sequenceable library
RNA selection / depletion
↓
Fragment RNA · reverse transcribe · make double-stranded cDNA
↓
Prepare ends · attach adapters and sample indexes
↓
Optional / protocol-dependent PCR · library QC · pool
A representative workflow: some protocols fragment cDNA instead, combine steps, or use different adapter-addition strategies. Strand-specific chemistry preserves information about the original RNA strand.
Adapters give each fragment an interface
AdapterRNA-derived DNA insertAdapter
Flow-cell binding sequences tether the library to the surface.
Sequencing-primer sites let reads begin at defined positions.
A sample index identifies the pooled library.
A UMI, when included, tags an original molecule before amplification.
Index ≠ UMI: sample identity and molecule identity answer different questions.
Why make a cluster?
A single library molecule
One labelled base is too dim for the classical ensemble imaging strategy.
Local amplification creates a clonal cluster of many copies.
A brighter local signal
Copies ideally incorporate the same base in the same cycle.
The imager reads the combined signal at that position.
A cluster is a technical copy population, not a biological replicate.
Bridge amplification: tether, bend, copy, separate
A library strand binds a complementary surface oligo and is copied. The free end of the tethered copy binds a nearby compatible oligo, forming a bridge. Polymerase makes a complementary strand; denaturation leaves two tethered strands. Repetition makes a local clonal cluster.
Solution PCR versus surface amplification
PCR in solution
Classical bridge amplification
Primers
Free in the liquid
Tethered to the surface
Products
Dispersed through the tube
Remain near the seed molecule
Main teaching purpose here
Enrich/amplify a library
Make individually imaged clusters
Shared principle
Primer binding → extension → separation
Primer binding → extension → separation
The library contains DNA derived from RNA, not RNA being copied by DNA polymerase.
Bridge amplification is a teaching model—not every flow cell
Classical flow cells
Randomly positioned clusters can be generated by bridge amplification.
Patterned flow cells
Defined nanowells control cluster positions; Illumina platforms can use exclusion amplification (ExAmp) and platform-specific clustering chemistry.
Keep the invariant idea: many local copies produce an interpretable sequencing signal. Check the instrument’s chemistry before describing its exact clustering method.
Sequencing by synthesis: one base, one image cycle
A primed template receives fluorescent reversible-terminator nucleotides. One base is incorporated, imaging identifies it, then the dye/block is removed. Repeating the cycle generates a read. Teaching read: ACGT; template: 3′-TGCA-5′.
Paired-end sequencing reads both ends of a fragment
Read 1 →DNA insert← Read 2
The two reads originate from the same library fragment.
They can improve placement across repeats and splice junctions.
The middle may remain unsequenced if the insert is longer than both reads combined.
Paired reads are two observations of one fragment, not two independent RNA molecules.
Index reads identify the sample; they are separate from the biological insert reads.
What comes off the sequencer?
@fragment_001/1ACGTACGTACGT+IIIIIIIIIIII
A read identifier, a nucleotide sequence, and per-base quality scores.
Demultiplexing assigns reads to samples using their indexes.
Base qualities describe confidence in calls—not biological importance.
Inspect adapters, quality, contamination and library composition before interpretation.
Spliced reads connect RNA-seq to alternative splicing
E1E2E3
Read evidence
What does it support?
Inside shared E1
Expression, but not a unique isoform
Across E1–E2 or E2–E3
Exon 2 inclusion
Across E1–E3
Exon 2 skipping
A splice-aware genome alignment can jump across introns. Transcriptome-based quantification uses a different reference representation.
Short reads may not uniquely resolve complete isoforms.
Gene expression and isoform usage are different questions
Illustrative molecule counts
Condition A
Condition B
Isoform with exon 2
80
20
Isoform without exon 2
20
80
Total for the gene
100
100
Gene-level abundance is unchanged, while exon inclusion falls from 80% to 20%.
Real RNA-seq estimates must account for ambiguity, effective length, sampling and replicate variation. These are idealised molecule counts, not raw read counts.
From reads to a gene-by-sample matrix
Quality control and sample assignment
↓
Splice-aware alignment OR transcript-level quantification
↓
Summarise expression with an appropriate gene/transcript model
Raw counts depend on sequencing depth and composition. A count is not automatically an absolute number of cellular RNA molecules.
Choose a technology for the biological question
Question or property
Microarray
Short-read RNA-seq
Known genes
Probe-based intensity
Sequence-derived abundance
Unanticipated transcripts
Limited by probe design
Can provide new sequence evidence
Alternative splicing
Needs informative probes
Junctions and isoform evidence
Main limitations
Cross-hybridisation, saturation
Sampling, mapping ambiguity, library bias
Protein abundance?
Not directly
Not directly
Both need good design, controls, replication and validation.
Applications
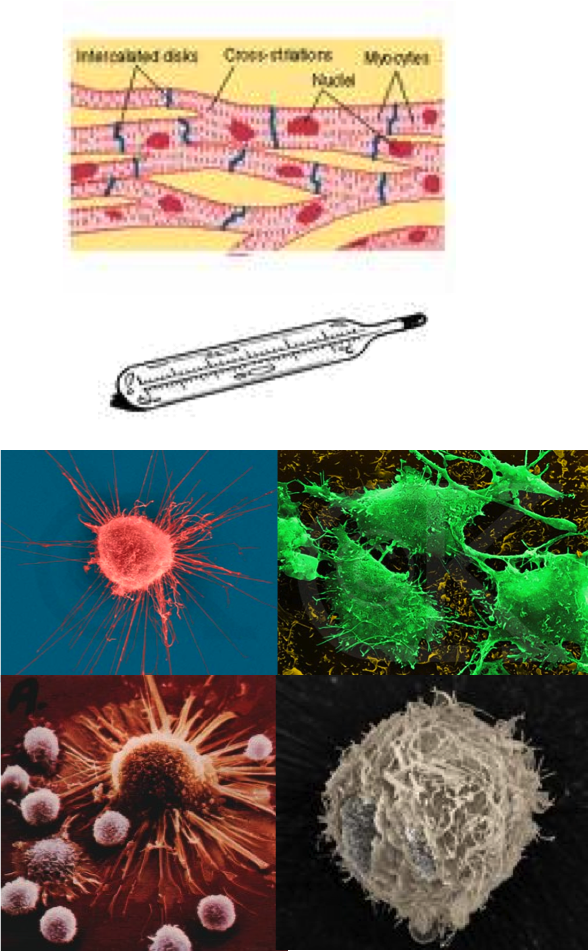
Compare RNA abundance in cardiac versus skeletal muscle, or across cell differentiation.
Cells exposed to different conditions.
Physical (temperature, radiation).
Chemical (toxins).
Changing nutrient availability.
Compare tumour with matched non-tumour samples.
Study disease-associated expression changes alongside other molecular and clinical evidence.
Drug response.
Historical case study: measurement is not validation
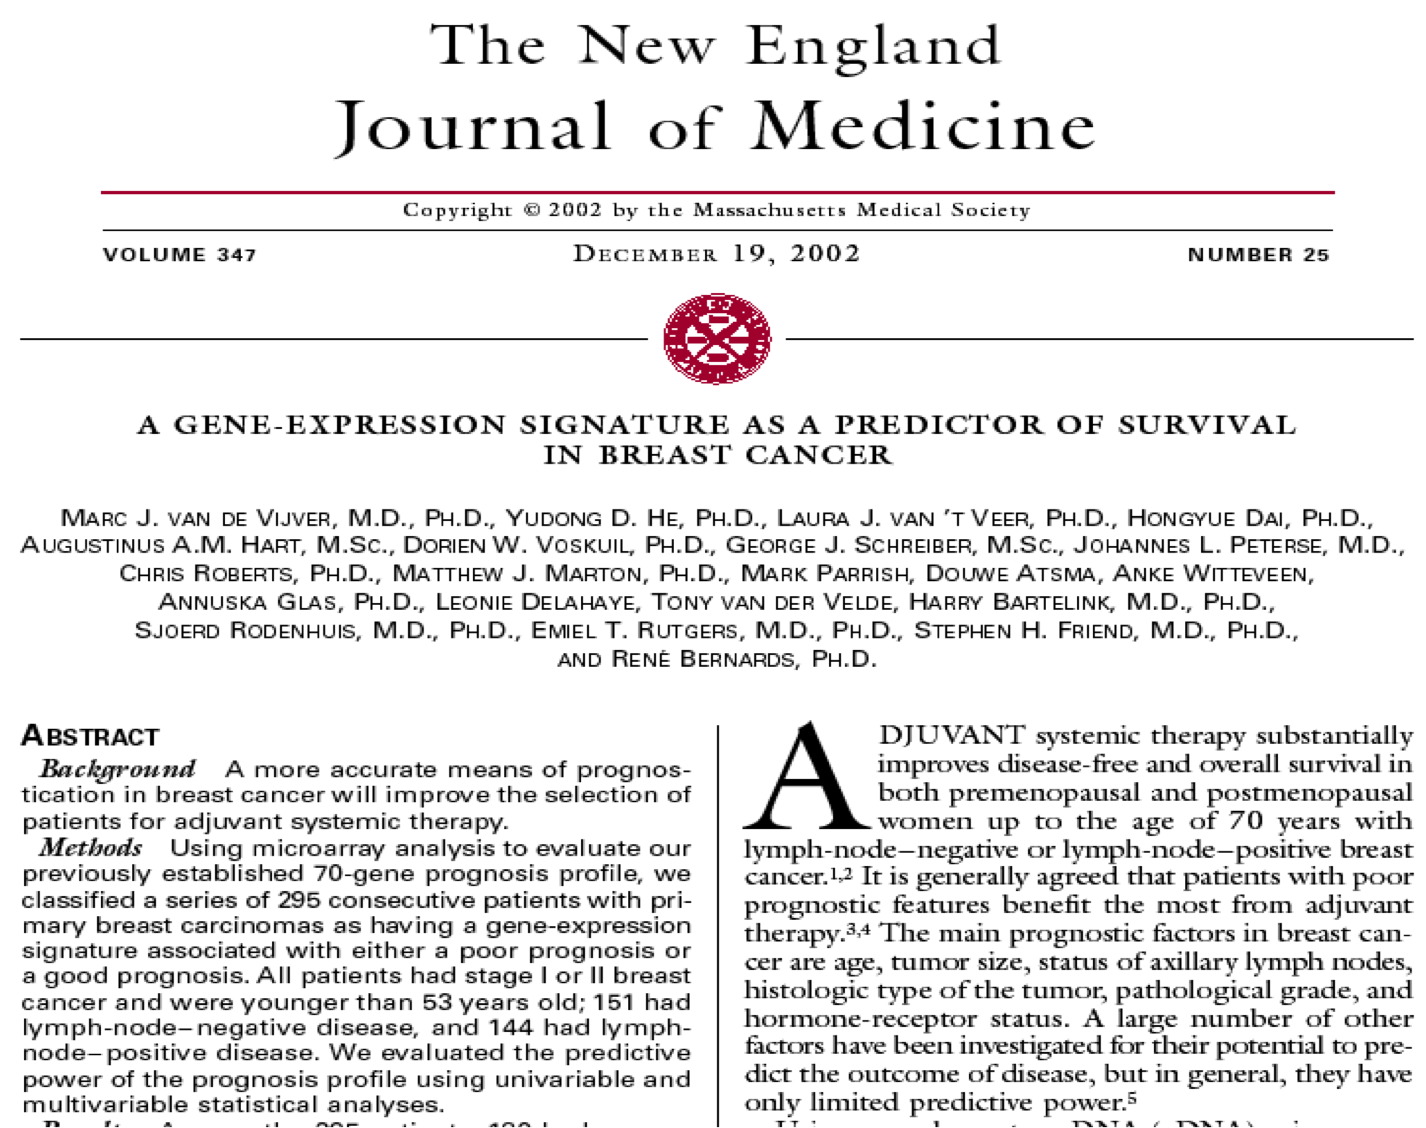
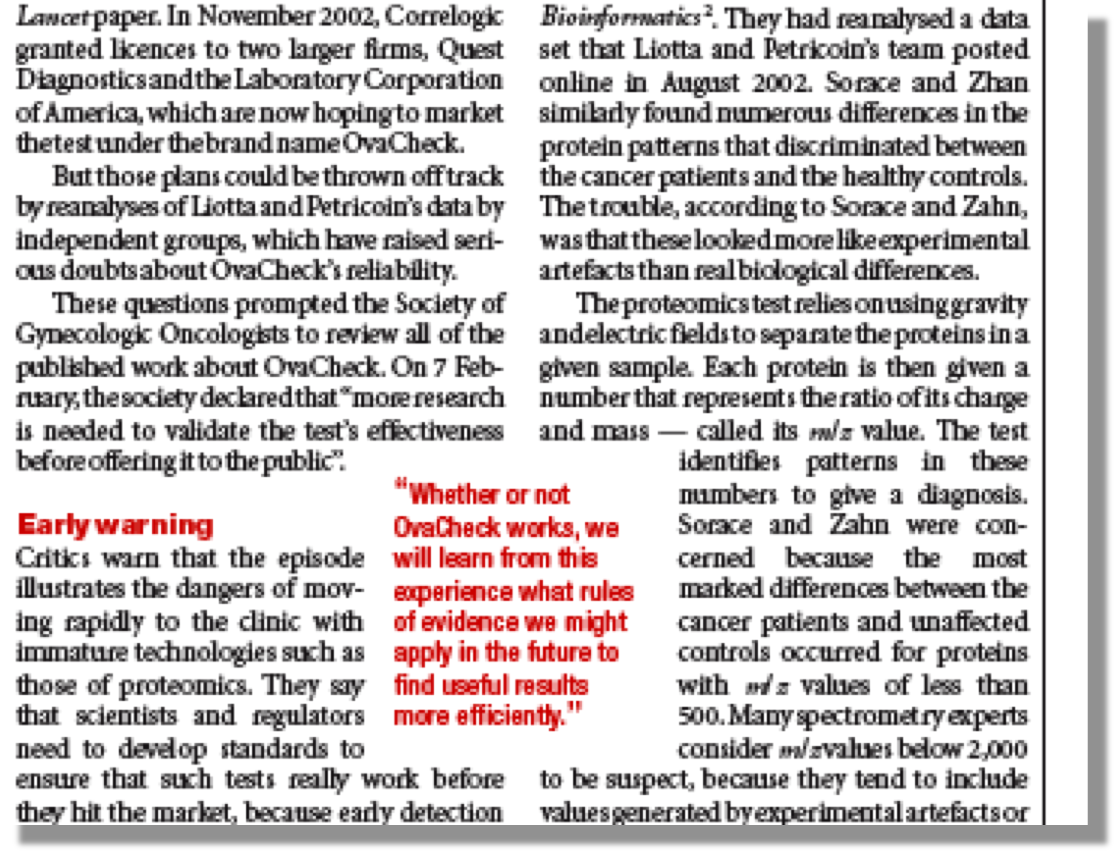
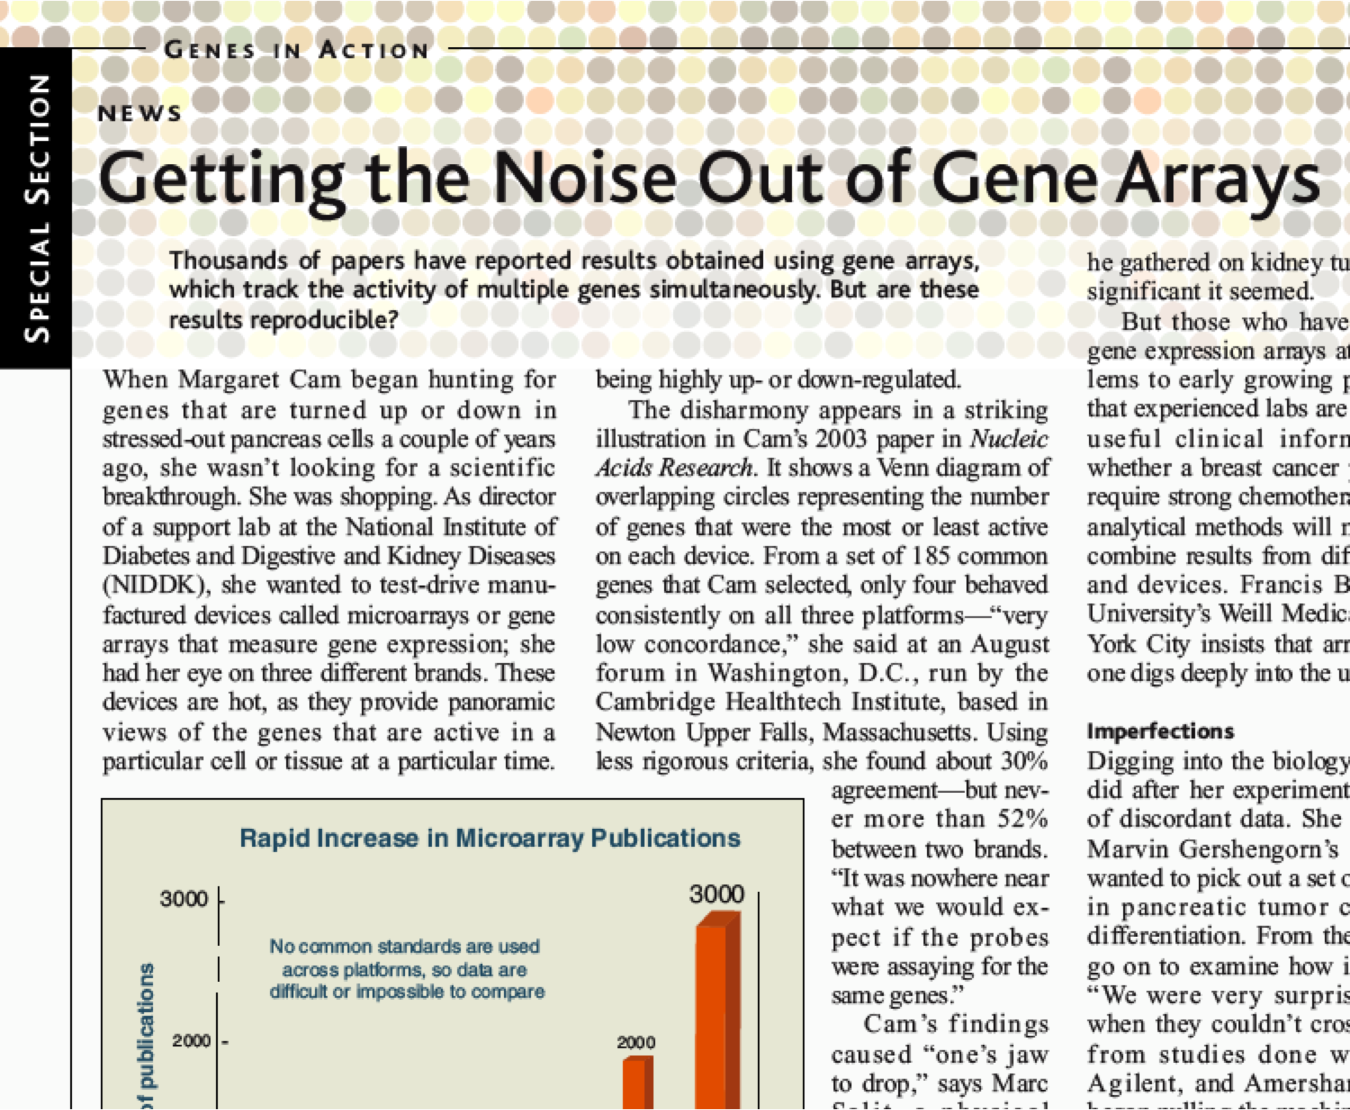
The following original figures document early biomarker enthusiasm and reproducibility concerns.
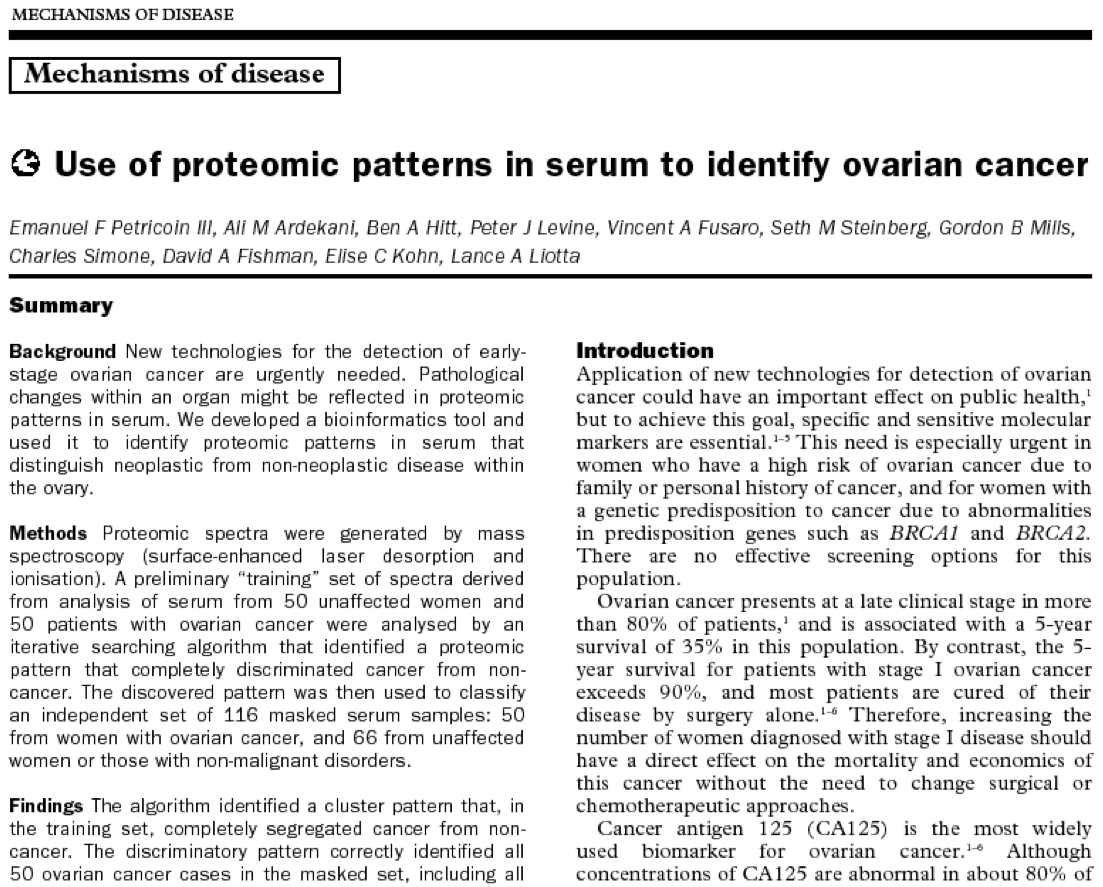
The ovarian-cancer example concerns serum proteomics, not RNA-seq.
Historical performance estimates apply to the reported study, not to general clinical use.
The shared lesson is experimental design, independent validation and reproducible analysis.
The technology produced a breakthrough
The technology produced a breakthrough
Proteomics, Petricoin, Lancet 2.02
“The discriminatory pattern correctly identified all 50 ovarian cancer cases in the masked set, including all 18 stage I cases. Of the 66 cases of non malignant disease, 63 were recognized as not cancer. This result yielded a sensitivity of 100% specificity of 95%”
``New cancer test stirs hope and concern’’ Pollack A. New York Times, Feb. 3, 2004
“I’ve been in cancer research for 40 years and I think it’s the most important breakthrough in those years,” said Dr. John S. Kovach, director of…
Correlogic Systems… Quest Diagnostics and LabCorp… say they expect to begin offering the test in the next few months.
Early biomarker claims: reproducibility concerns
Why independent validation matters
On Reproducibility
Check your understanding
Can two samples have equal gene expression but different splice-isoform proportions?
Why does one-colour microarray comparison require separate chips?
In chip manufacture, what determines where the next nucleotide attaches?
How are reverse transcription, PCR and bridge amplification different?
What does an RNA-seq read tell you—and what does it not tell you?
Next: preprocessing, quality control and differential expression.
Detailed provenance and reuse information: MEDIA_SOURCES.md. Original interactive diagrams are editable teaching schematics; they simplify molecular scale and chemistry.