Bioinformatics · Universitat Politècnica de Catalunya
Alexandre Perera-Lluna
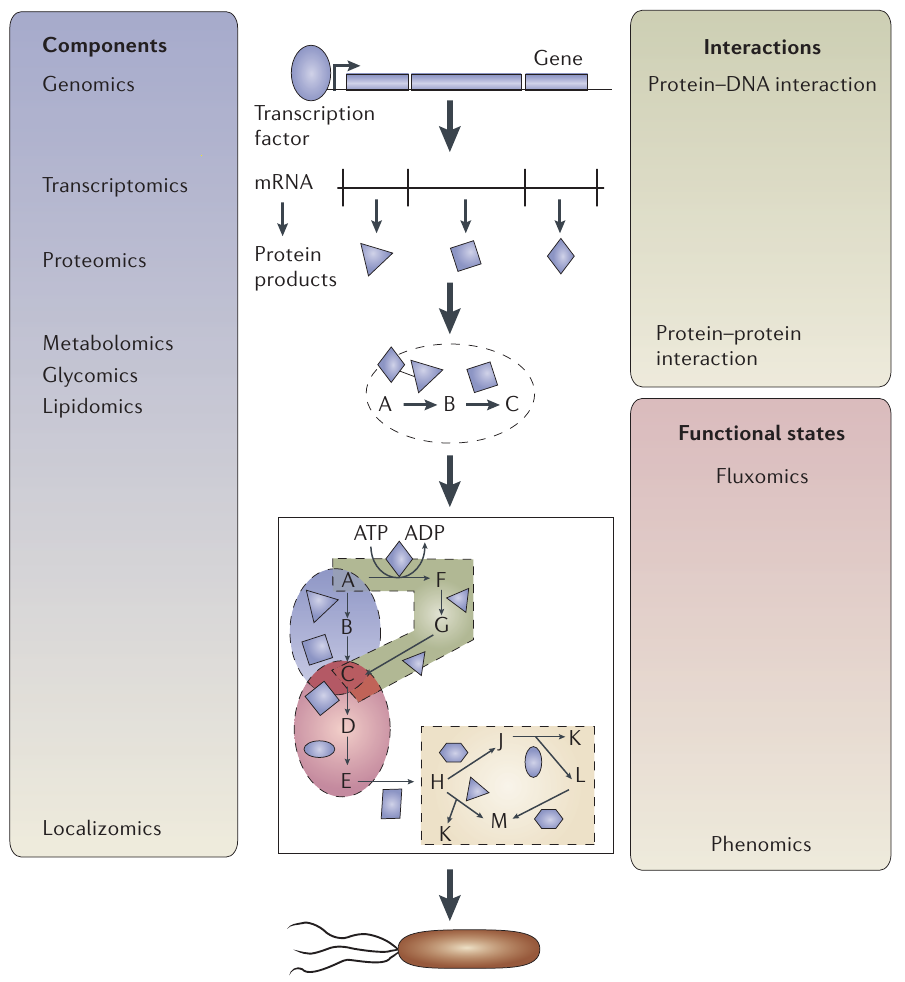
Omics measures different molecular layers
Layer
What is measured
Genomics
DNA sequence and variation
Transcriptomics
RNA abundance and transcript structure
Proteomics
Protein abundance, forms, and modifications
Metabolomics
Small molecules under defined conditions
No layer alone gives a complete description of biological function. Measurement coverage and interpretation depend on technology and study design.
Omic sciences
Overview
Omics overview (Joyce and Palsson 2006).
Some slides about Metabolomics
Definition
Metabolomics is the science that studies the lightweight chemical compounds (metabolites) and reactions that take place in organisms.
Purpose
Metabolomics measures a context-dependent part of the molecular phenotype. Its utilities include (Nicholson et al. 2002):
Finding of biomarkers for disease
Understanding of diseases
Prediction of treatment outcome
Metabolomic Analysis Workflow contributions at B2SLab (1/2)
Fernández-Albert F., Llorach R., Garcia-Aloy M, Ziyatdinov A, Andrés-Lacueva C., Perera-Lluna A. Intensity drift removal in LC/MS metabolomics by Common Variance Compensation. Bioinformatics 30 (20): 2899-2905. (2014).
Fernández-Albert F., Llorach R., Andrés-Lacueva C., Perera-Lluna A. An R package to analyse LC/MS metabolomic data: MAIT (Metabolite Automatic Identification Toolkit). Bioinformatics 30(13):1937-9 (2014).
Fernández-Albert F., Llorach R., Andrés-Lacueva C., Perera-Lluna A.Peak Aggregation as an Innovative Strategy for Improving the Predictive Power of LC-MS Metabolomic Profiles. Analytical Chemistry 86 (5), 2320-2325 (2014).
Published R packages on metabolomics (available on our website http://b2slab.upc.edu) and on Bioconductor:
MAIT
MAIT: Metabolite Automatic Identification Toolkit. An R package to perform end-to-end LC/MS metabolomic data analyses.
Metabolomic Analysis Workflow contributions at B2SLab (2/2)
intCor
This package performs an intensity drift correction for large datasets through several methods. This library is contains the non-linear methodology to perform retention time correction in LC/MS.
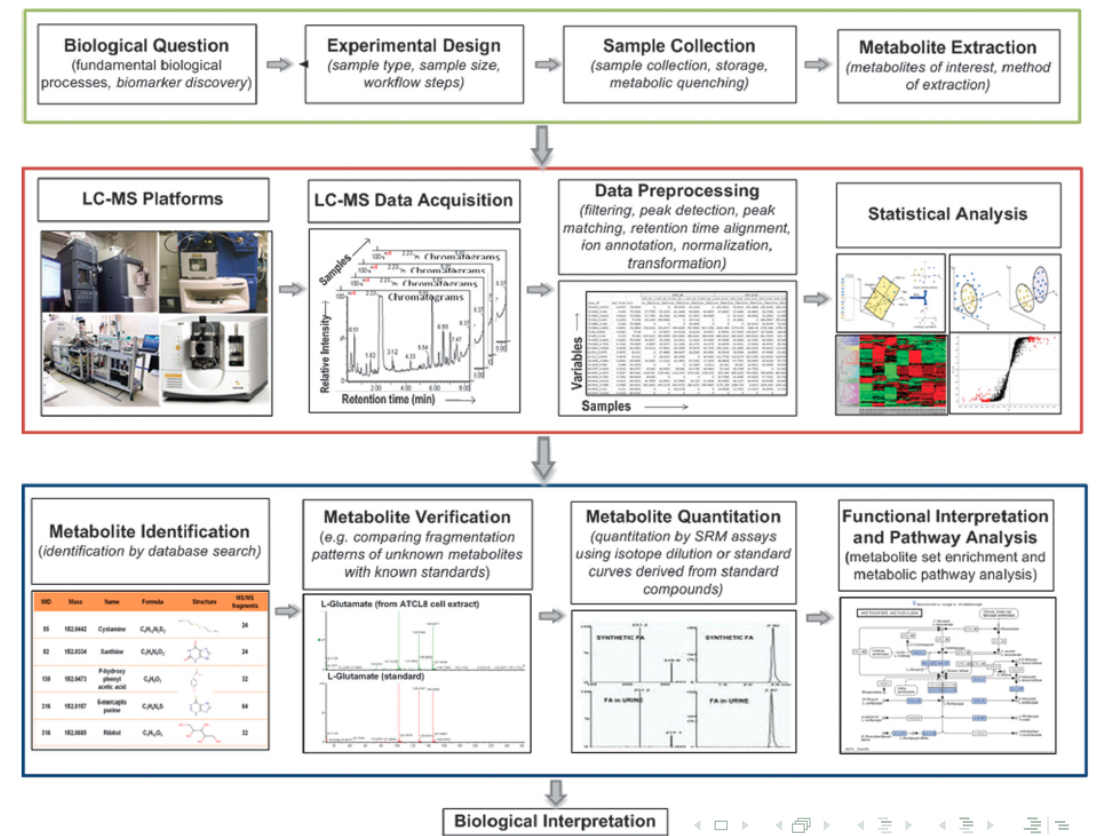
Metabolomic Analysis Workflow (LC/MS)
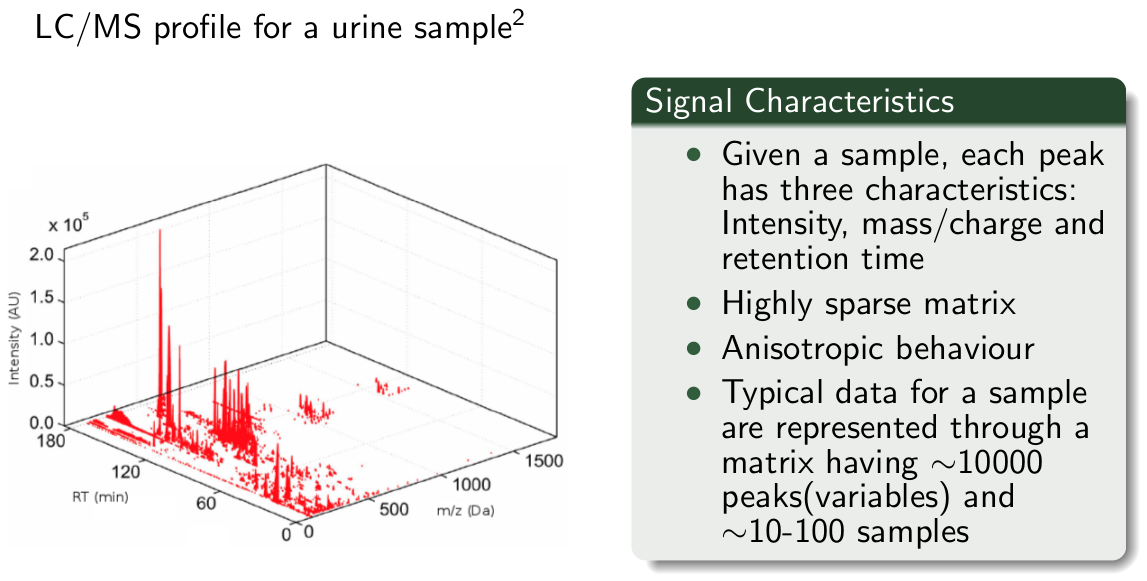
LC/MS signals
^2Wei Guan et al. BMC Bioinformatics 10:259, 2009
Signal to noise?
Metabolomics data (1/2)
Primary and secondary analyses
Primary analysis
Detect peaks
Annotate peaks
Quantify metabolites
Secondary analysis
Statistics
Machine learning
Enrichment techniques
Metabolomics data (2/2)
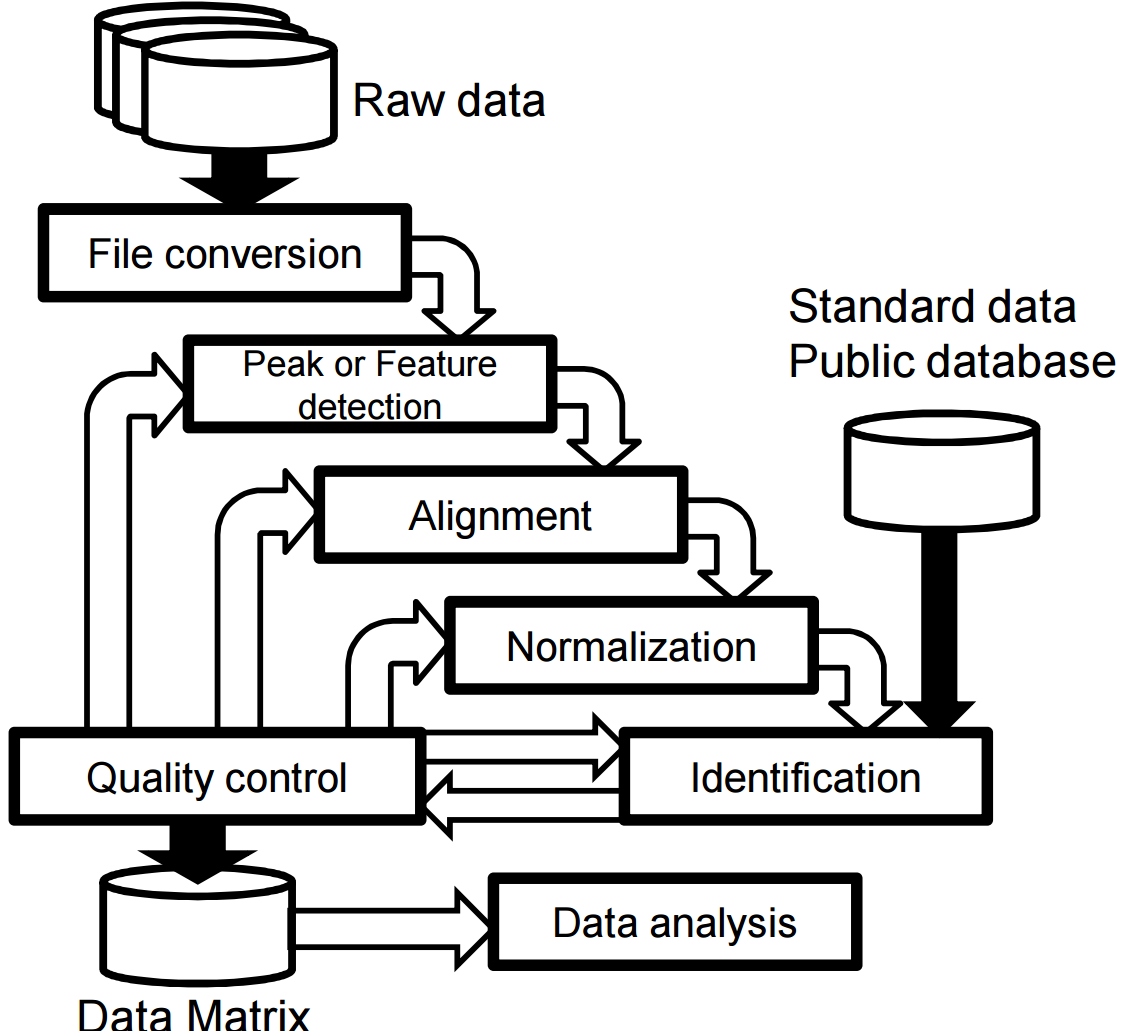
Metabolomics workflow (Sugimoto et al. 2012).
Functional Enrichment
Enrichment techniques
Experimental data can be understood in the framework of the known biological context. Enrichment techniques relate this data to biological pathways.
Enrichment in gene expression
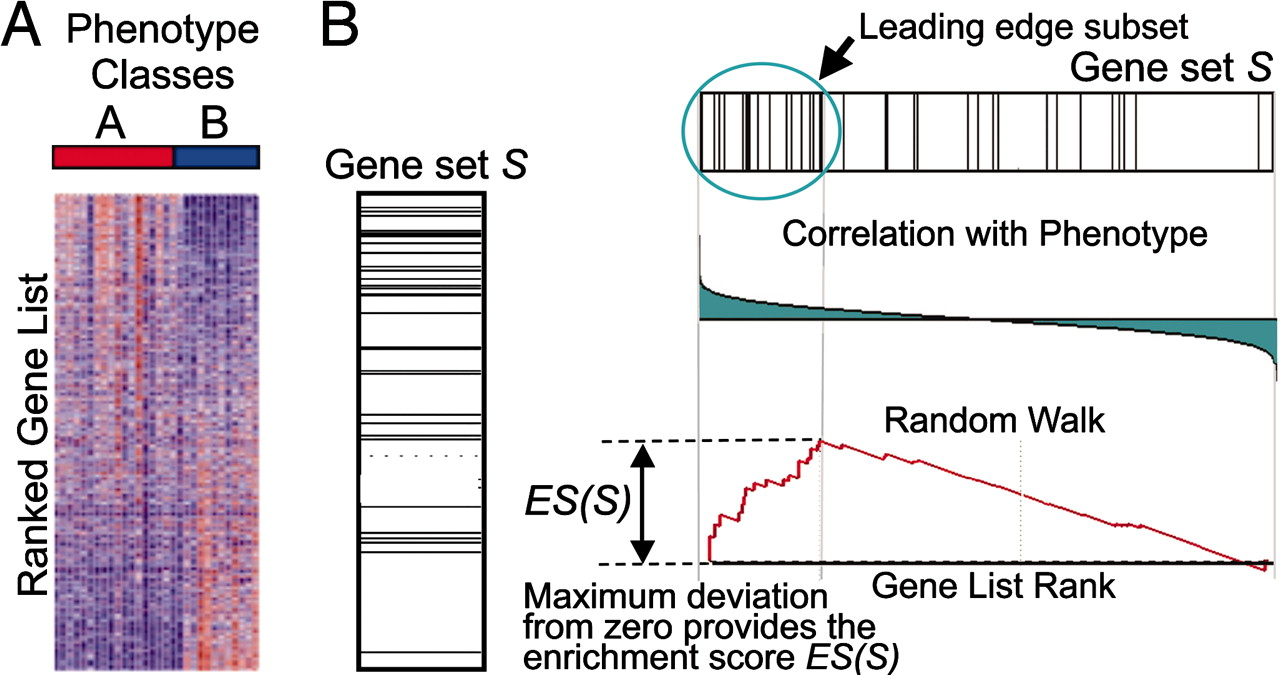
The challenge no longer lies in obtaining gene expression profiles, but rather in interpreting the results to gain insights into biological mechanisms.
(Subramanian et al. 2005)
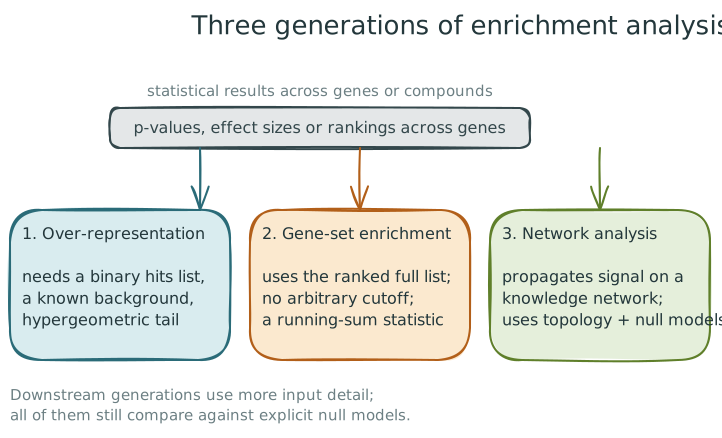
Three generations appear on later slides: over-representation (binary hits list, known background), gene-set enrichment (ranked full list, no cutoff), network analysis (signal propagated over a knowledge network).
Annotation provenance
Computational annotation: sequence comparison, predictive models, text mining, and other algorithms.
Manual curation: expert evaluation of experimental and computational evidence.
Combined workflows: computational proposals with human review.
Read the evidence and provenance attached to a claim. Annotation categories do not guarantee certainty.
Databases (II)
Genes and gene products
Gene Ontology: contains three ontologies and a hierarchical structure reflecting the specificity of the entry (Ashburner et al. 2000).
Proteomics
UniProt: comprehensive database for protein sequence and annotation data (Consortium 2015).
STRING: protein association database, including functional and physical associations; automatic and curated evidence (Szklarczyk et al. 2015).
Metabolomics
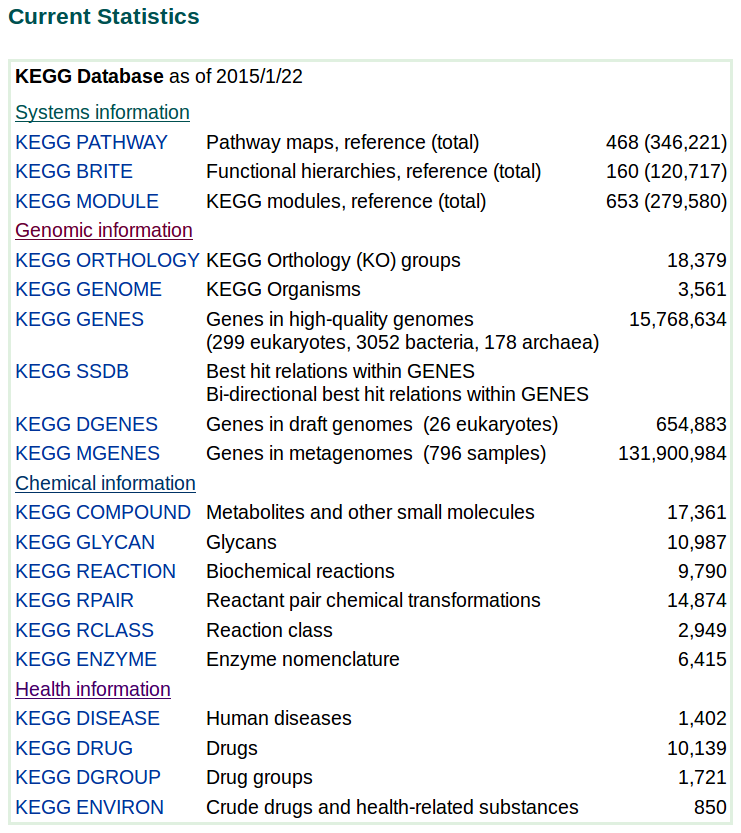
KEGG: comprehensive and curated pathway database (Ogata et al. 1999).
Reactome, BioCyc, WikiPathways, SMPDB
Gene Ontology
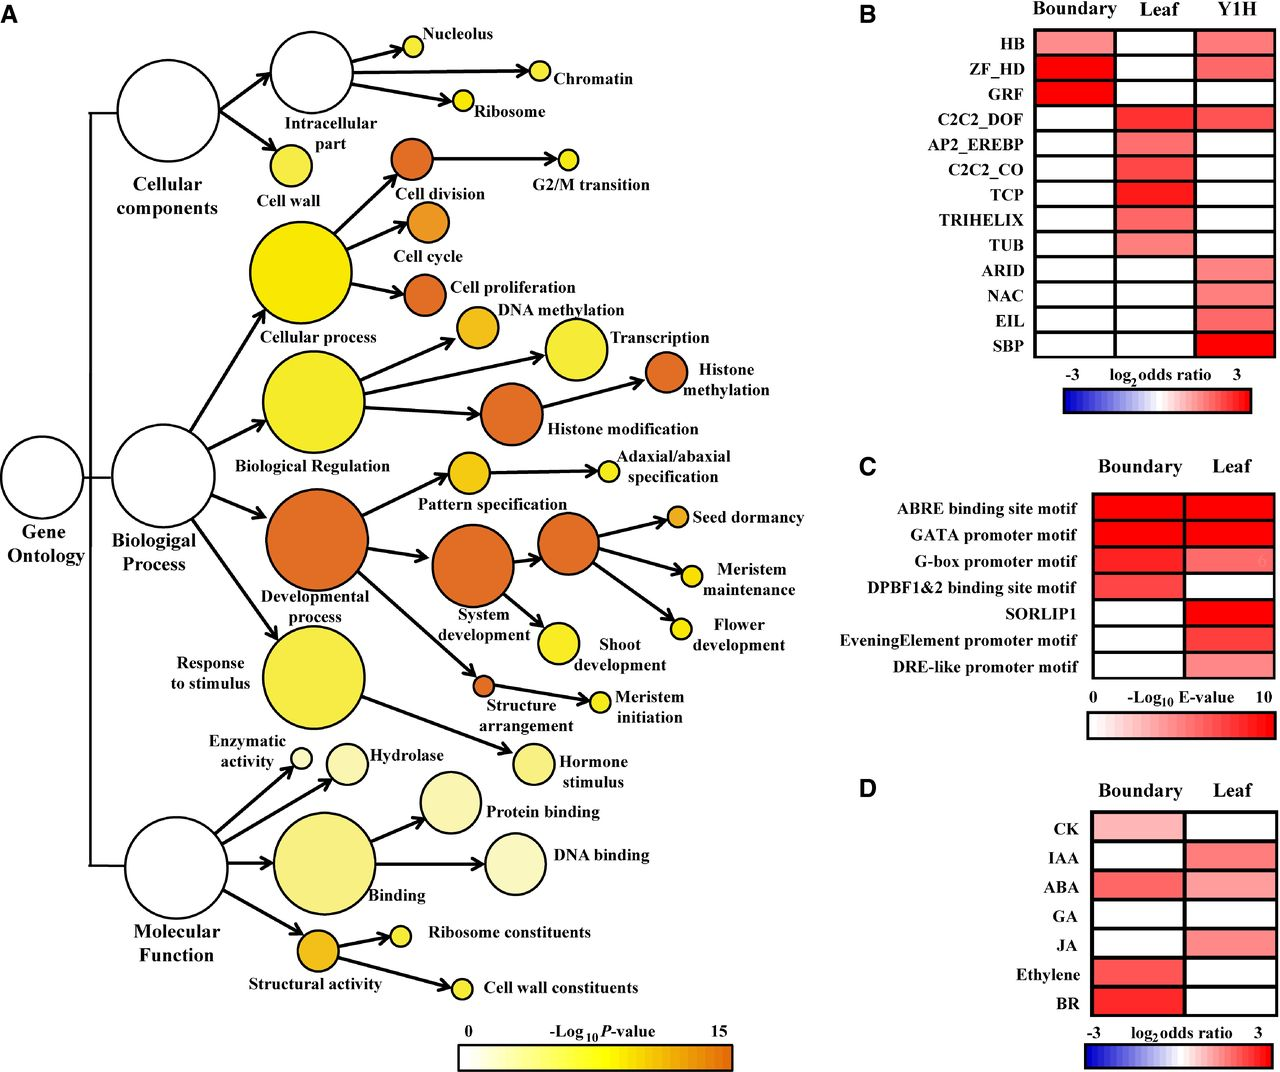
An example of GO overrepresentation analysis (ORA)(Tian et al. 2014).
Databases (III) (1/2)
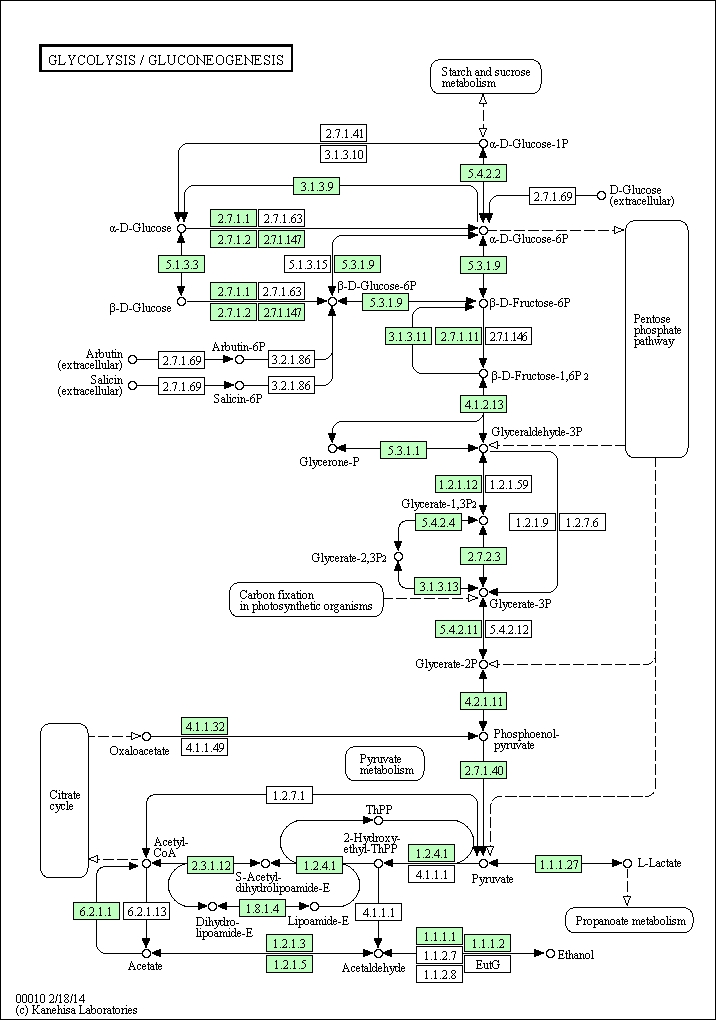
Examples
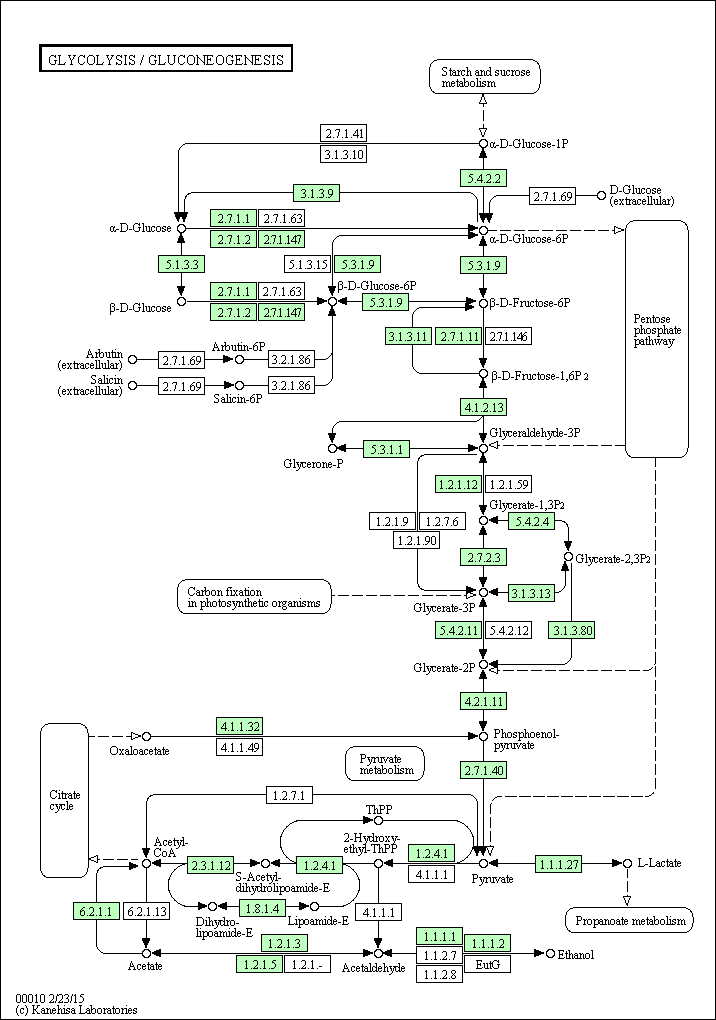
Glycolysis pathway in KEGG (Ogata et al. 1999).
Databases (III) (2/2)
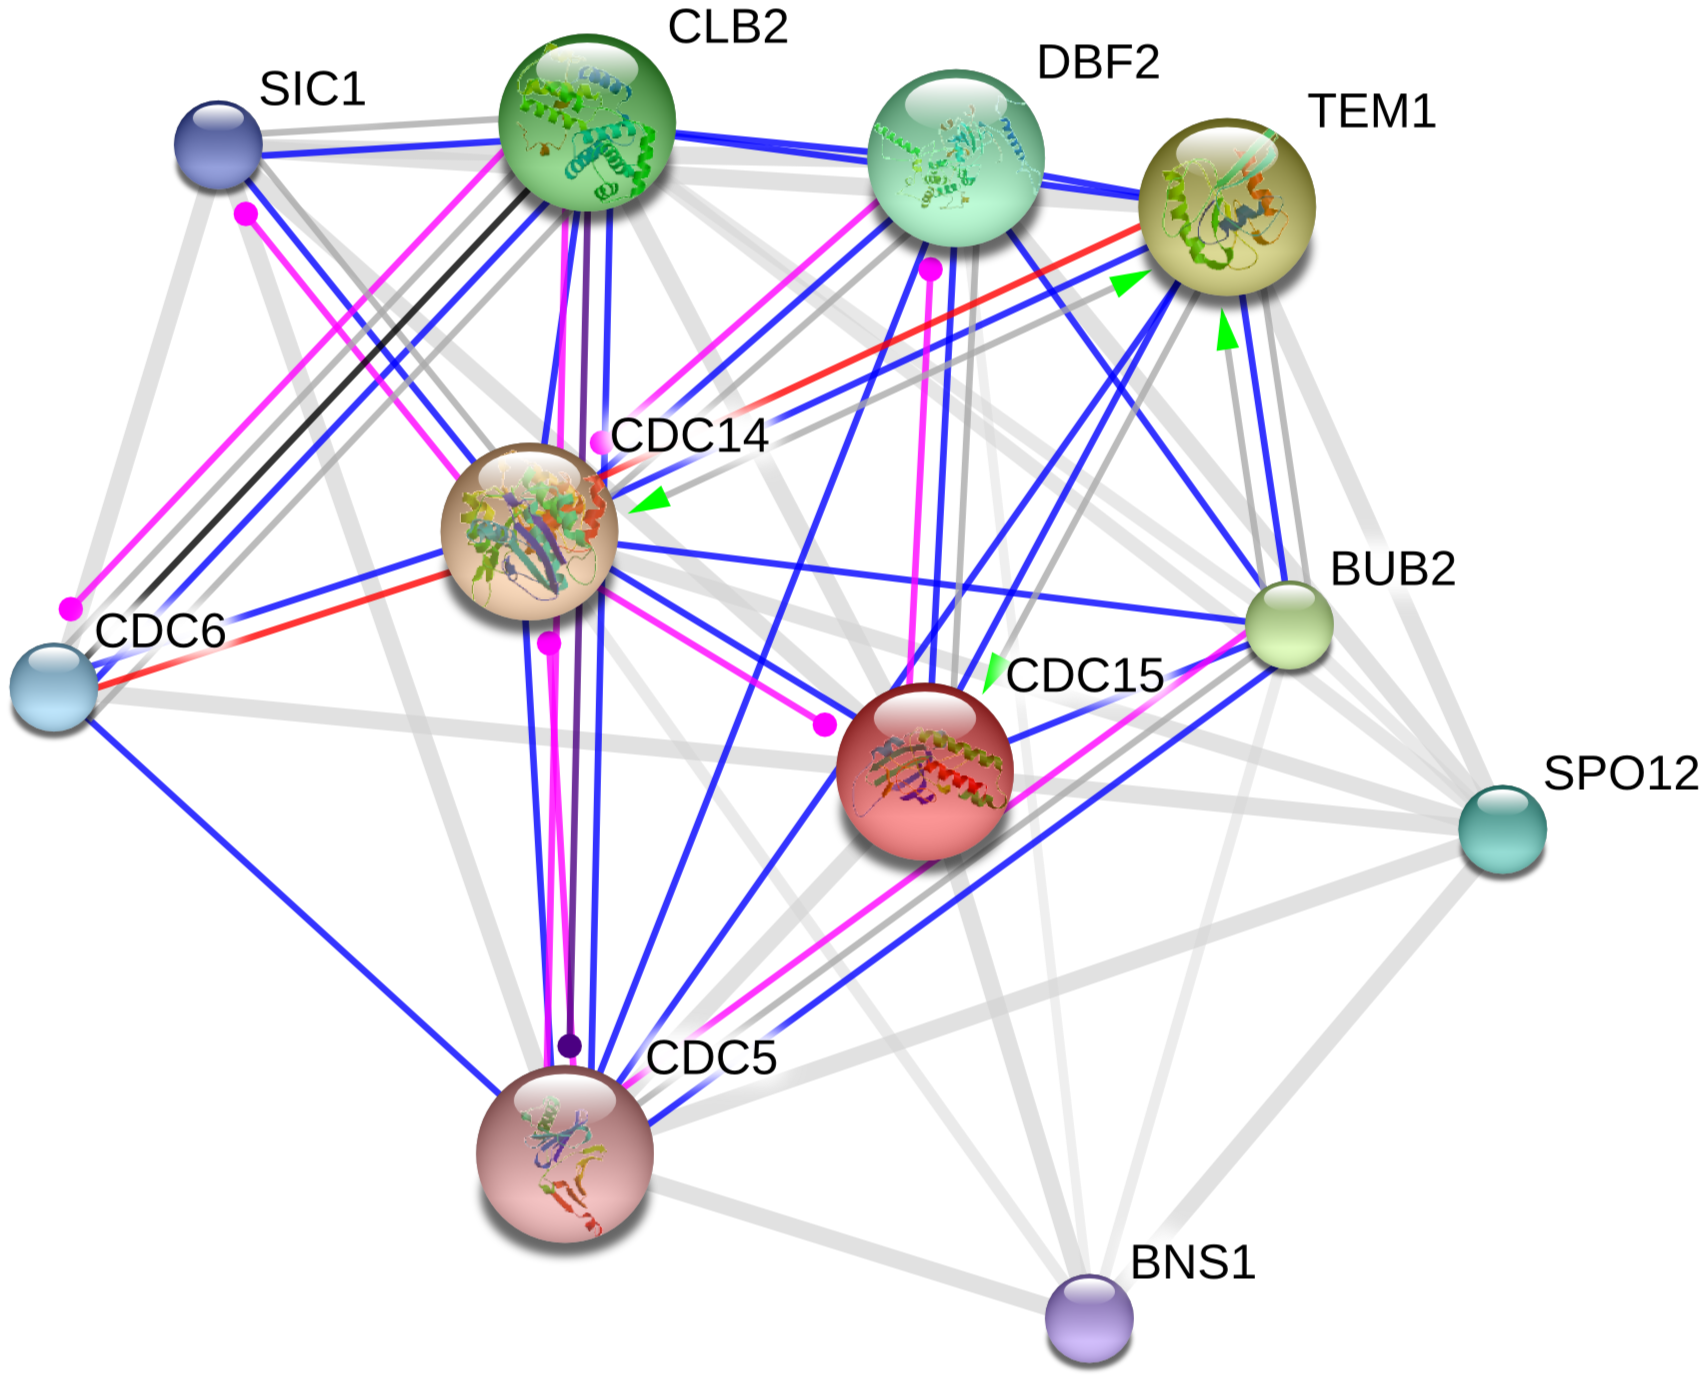
PPI network in STRING (Szklarczyk et al. 2015).
Over-representation analysis
Define a background of N genes that could have been selected. A pathway contains K of these genes; the selected list has n genes, with overlap k.
\log \frac{1}{p} incorporates a p-value from over-representation analysis in the original Pathway-Express formulation
PF(g) = \Delta E (g) + \sum\limits_{u \in US_g} \beta_{ug} \cdot \frac{PF(u)}{N_{ds}(u)} considers the topology of the genes within the pathway, and is similar to PageRank scores. N_{de} (P): N DE genes on P_i,
Gene data enrichment: network analysis (I)
Gene data enrichment: network analysis (II)
Advantages
Takes into account topological features.
Benefits from current knowledge and its structure.
Limitations
Pathway overlapping still remains an issue.
Rising need to incorporate cell line specificity data in order to become biologically sound.
Metabolomics data enrichment
Origin
Metabolomics is a young science that followed Genomics and Transcriptomics trends. Concepts for data enrichment have been therefore ported from them.
Differences from genomic data enrichment
Human reference genomes are available, but metabolite coverage depends strongly on the sample and measurement technology. The background for statistical tests is not obvious (Chagoyen and Pazos 2012).
Experimental devices can exhibit low sensitivity or noisy signals(Hollywood et al. 2006).
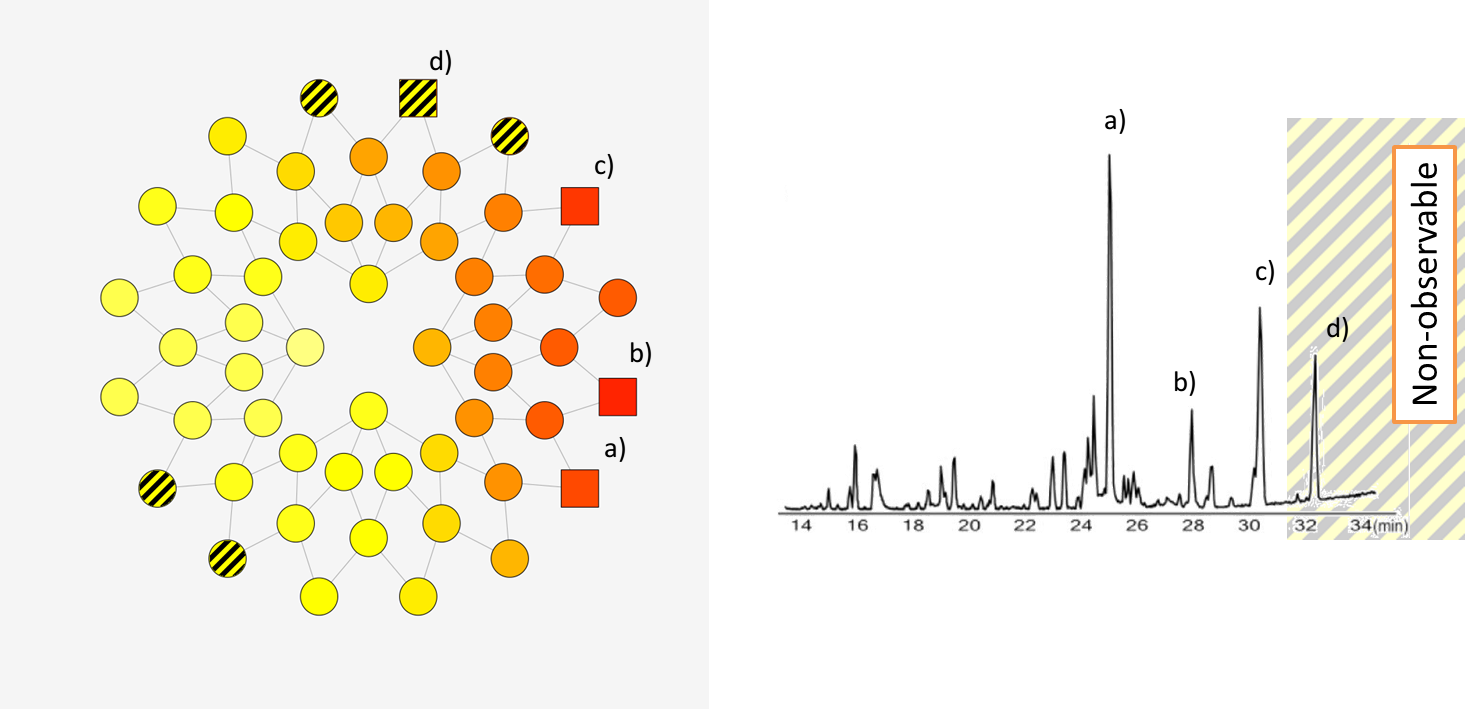
There is no technology to measure the full spectrum of compounds. Large part of the background is not observable.
Databases in Metabolomics
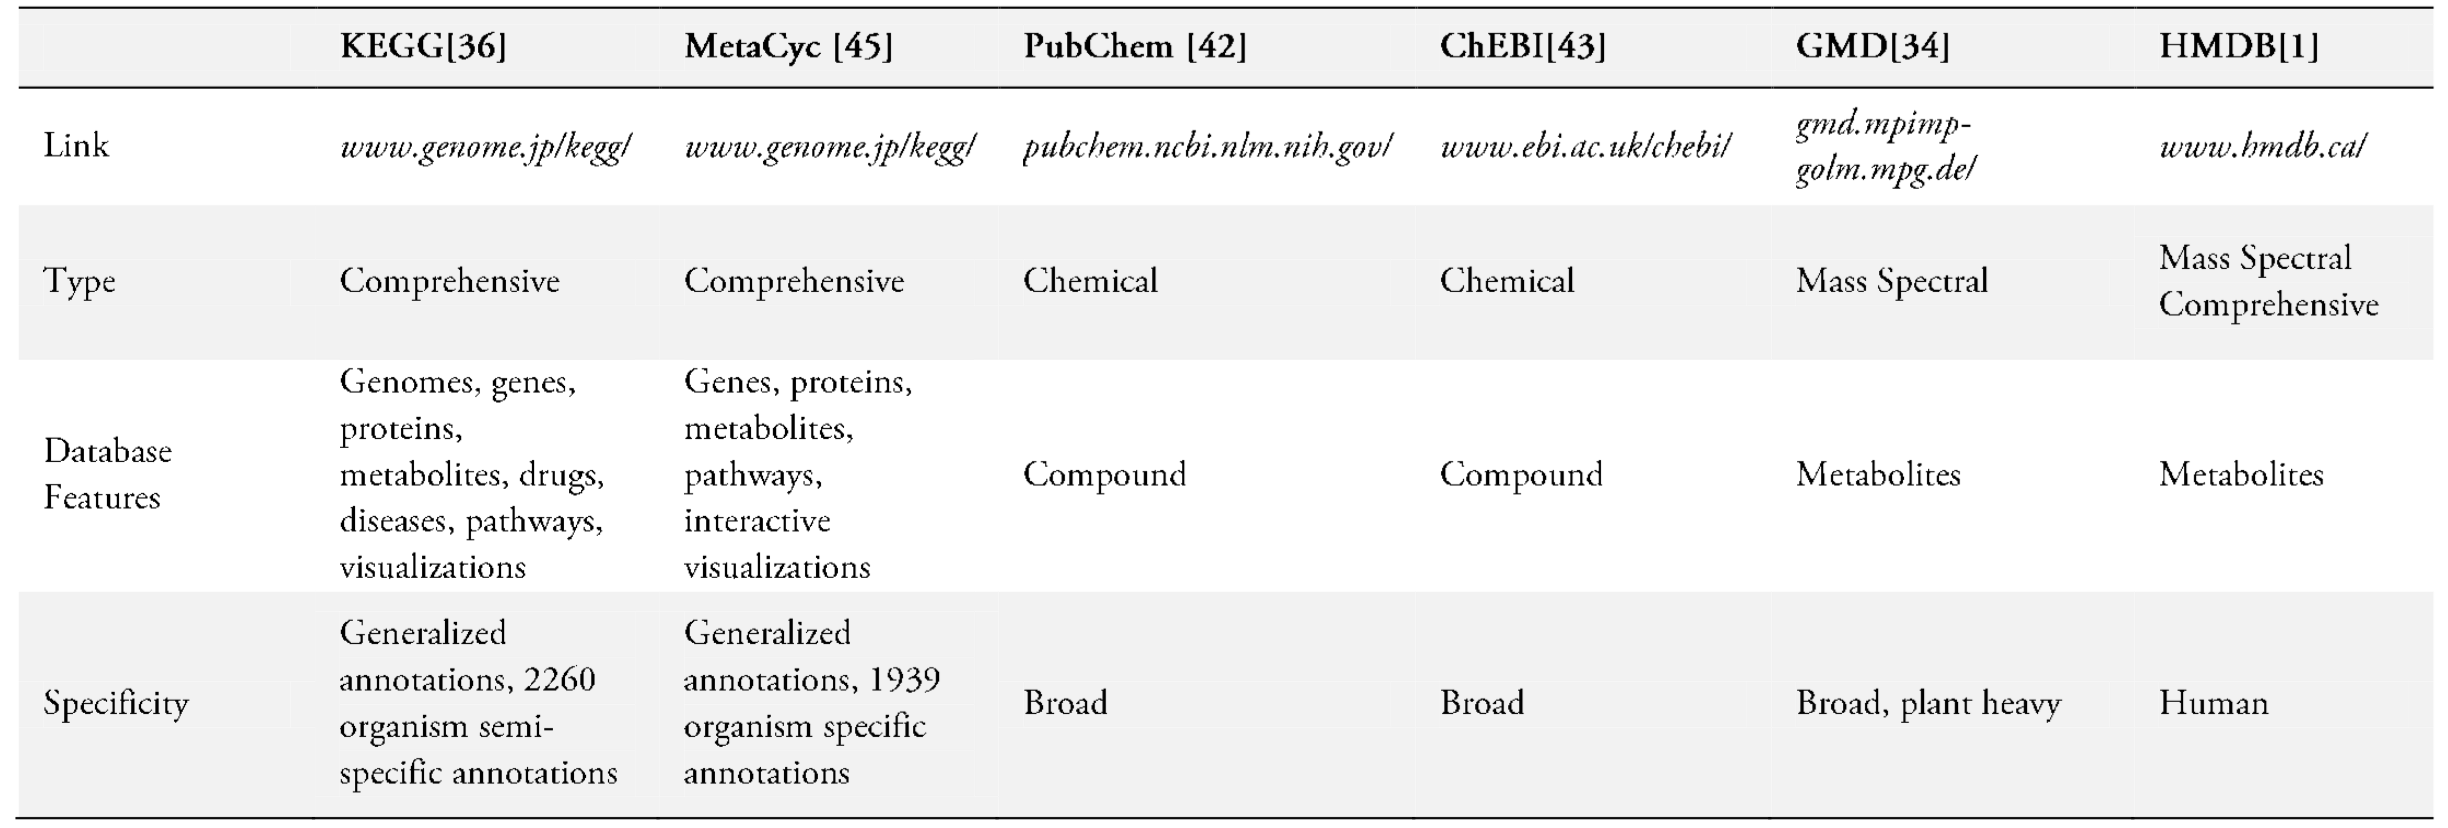
Main databases in Metabolomics (Booth et al. 2013). (correct link for MetaCyc is http://metacyc.org/), and I would add Reactome to the list http://reactome.org
Metabolomics data enrichment: overview (I)
Over Representation Analysis
IMPaLA (Kamburov et al. 2011)
MetaboAnalyst (Xia et al. 2012)
MPEA (Kankainen et al. 2011)
Metabolite Set Enrichment Analysis
MSEA in MetaboAnalyst (Xia and Wishart 2010b)
PAPi (Aggio et al. 2010)
Network Analysis
MetPA in MetaboAnalyst (Xia and Wishart 2010a)
Metabolomics data enrichment: overview (II)
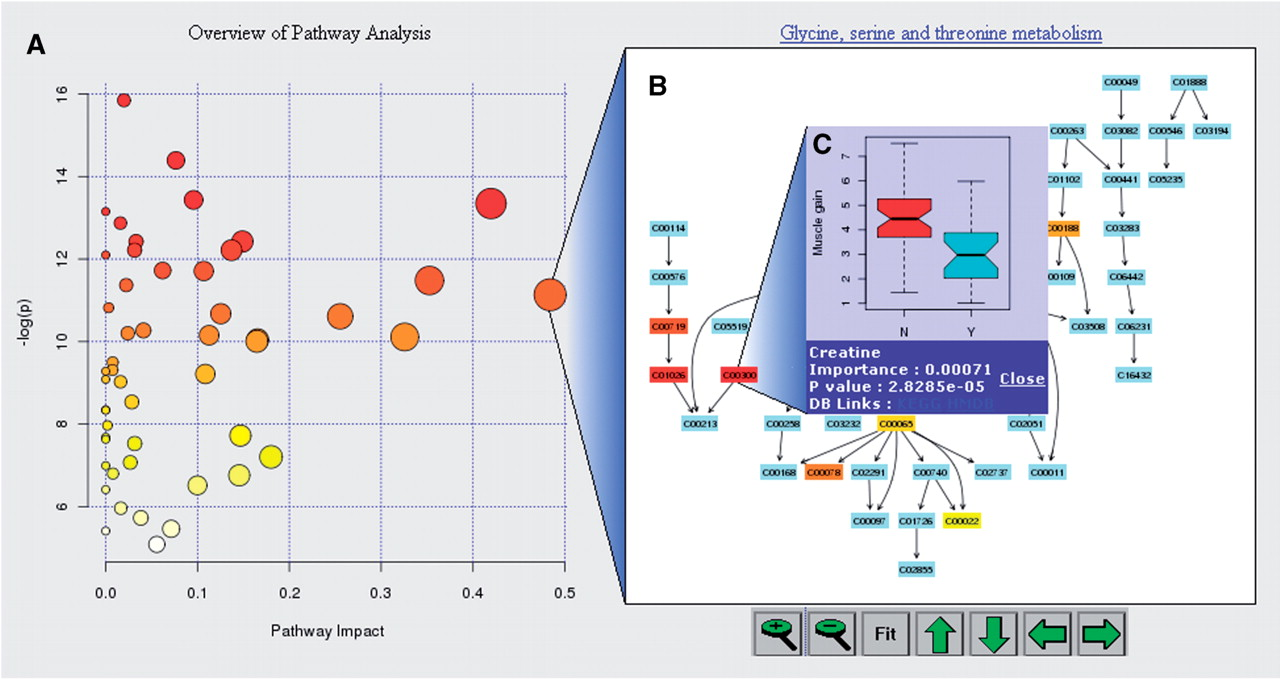
MetaboAnalyst (Xia et al. 2012)
MetaboAnalyst gathers topological analysis (x axis) and ORA or MSEA (y axis). It also depicts metabolite significance inside each pathway.
Inp.: Raw Spectra (GC and LC MS), peak lists and spectral bins (MS and NMR)
DBsd: Custom, KEGG, HMDB
Funs.: Full processing, Statistical Analysis
Comm: Comprehensive metabolomics analysis platform with easy interface, tutorials, help. Human focused though some model organisms or custom metabolite set option.
Comm: Comprehensive metabolomics analysis platform with easy interface, tutorials, help. Human focused though some model organisms or custom metabolite set option.
Comm: Combined analysis with proteins and transcripts. Organism independent. Direct visualization of results on networks. Time course analysis. Statistical analysis.
Comm: No choice of organism. Reported as non-functional in the source review
Adapted from a very nice review from (Booth et al. 2013)
Subnetwork analysis
Subnetwork methods combine molecular measurements with a network to identify connected groups of relevant entities.
Scored modules
Methods such as jActiveModules search for subnetworks with strong aggregate evidence. Search procedures need not find a guaranteed global optimum. (Ideker et al. 2002)
Diffusion methods
Methods such as HotNet propagate influence through a network and identify affected modules. Heat diffusion is not the same as maximum-flow optimisation. (Vandin et al. 2011)
Mining knowledge through B2SLab Fella
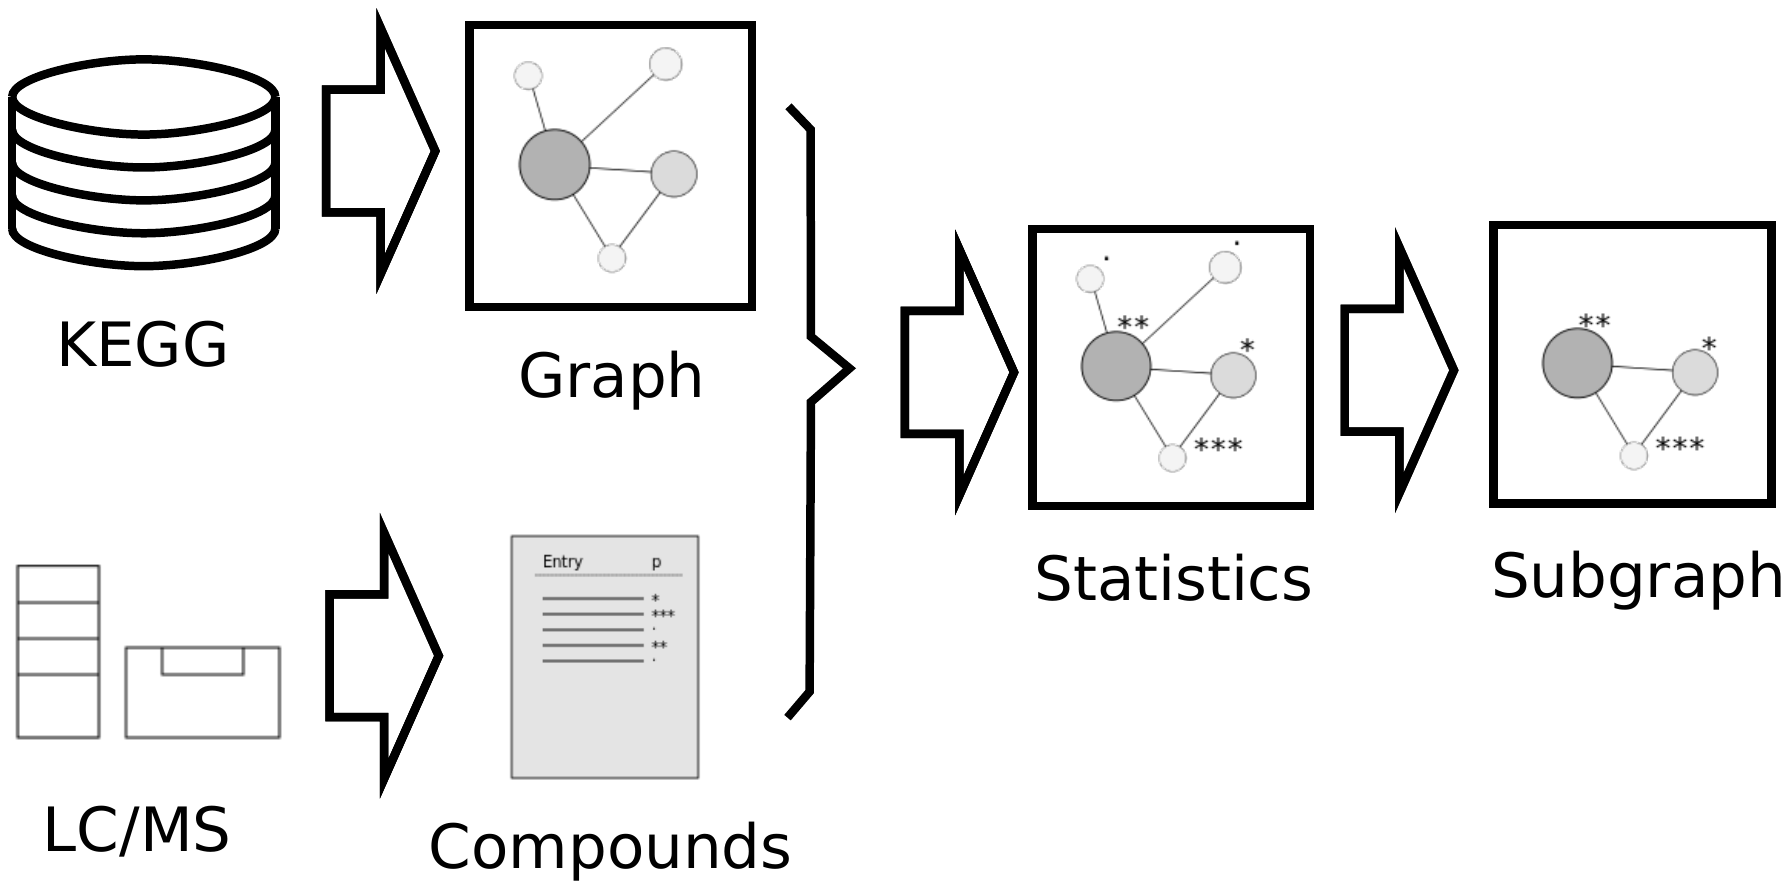
Problem addressed: enrichment techniques
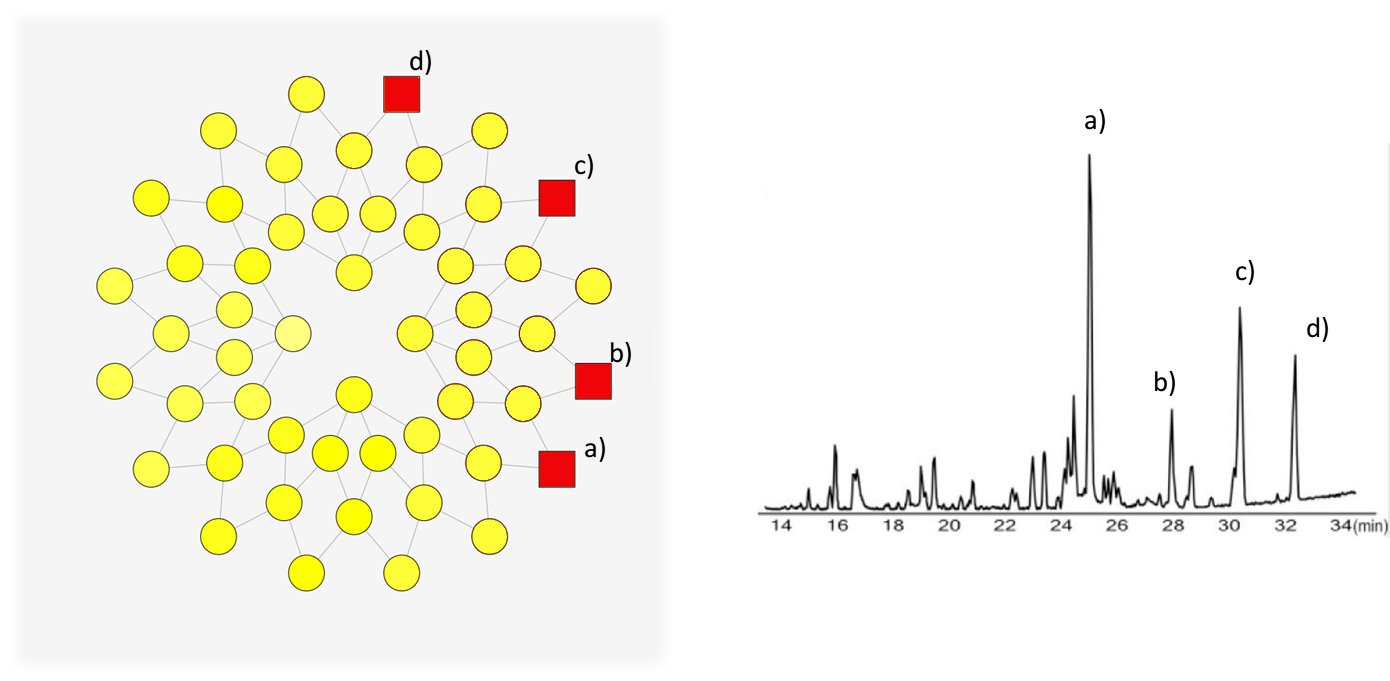
LC/MS provides data in terms of compounds of statistical relevance, but…
The researcher needs to understand what is going on the underlying biology.
A key concept are the metabolic pathways.
Pathway enrichment techniques bridge between both worlds.
Goal
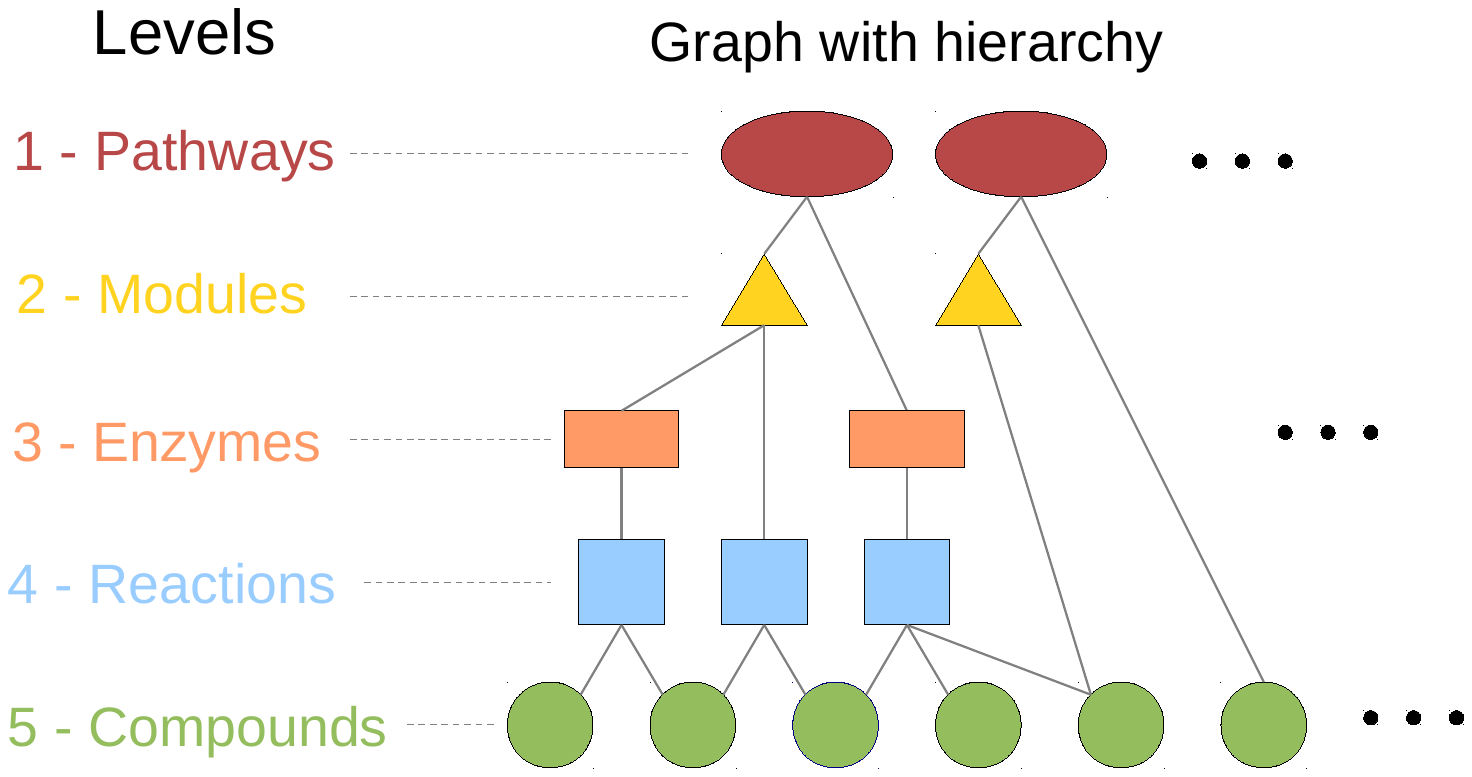
Integrate existing knowledge Base in form of a database with statistical results from compound analyses to perform a LC/MS pathway enrichment.
In addition…
Offer a complete interpretation of the biological elements involved in the experiment.
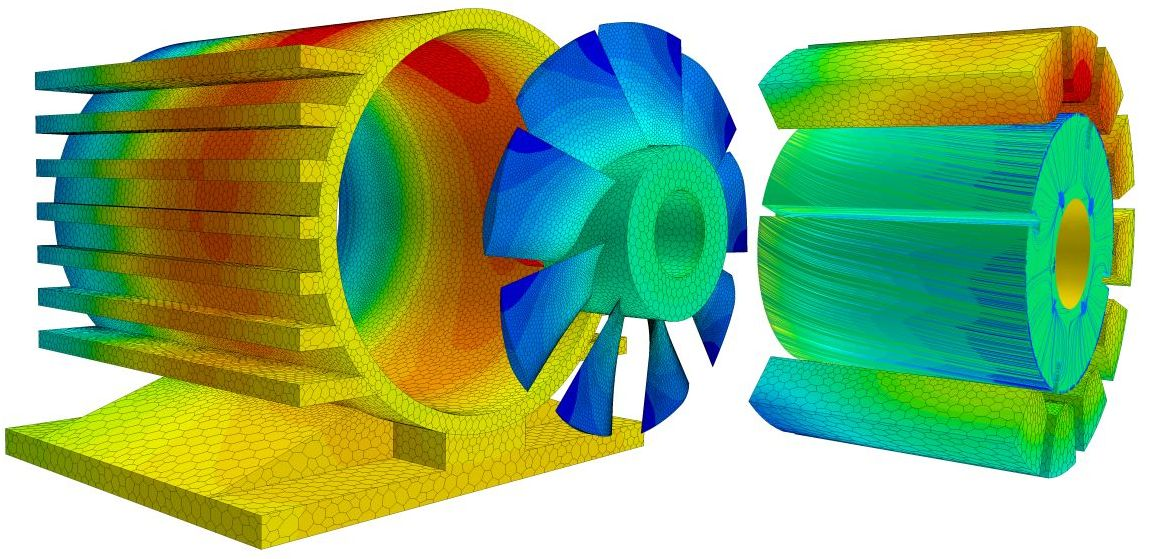
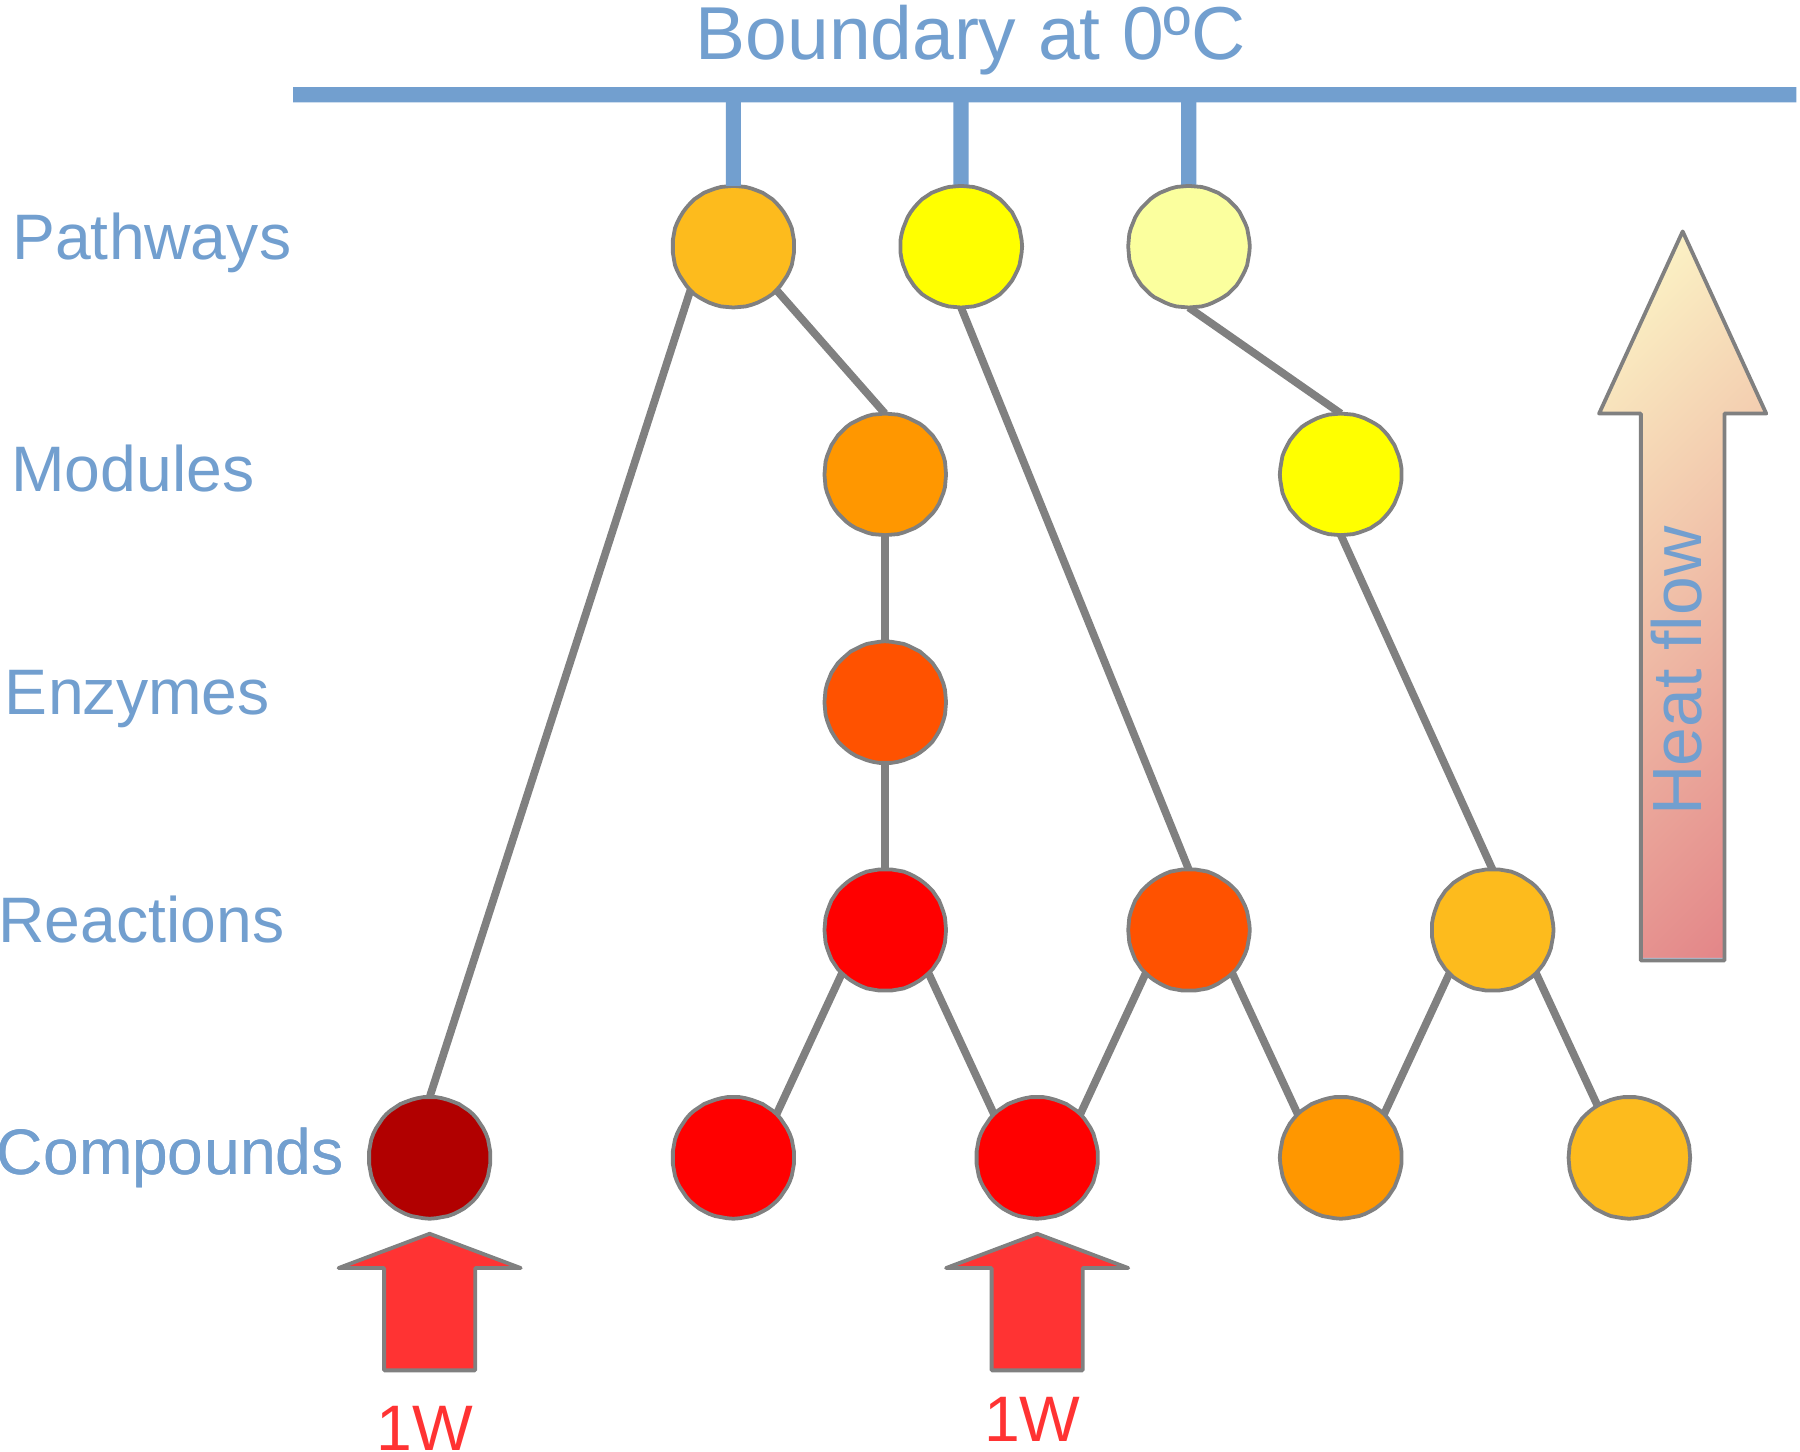
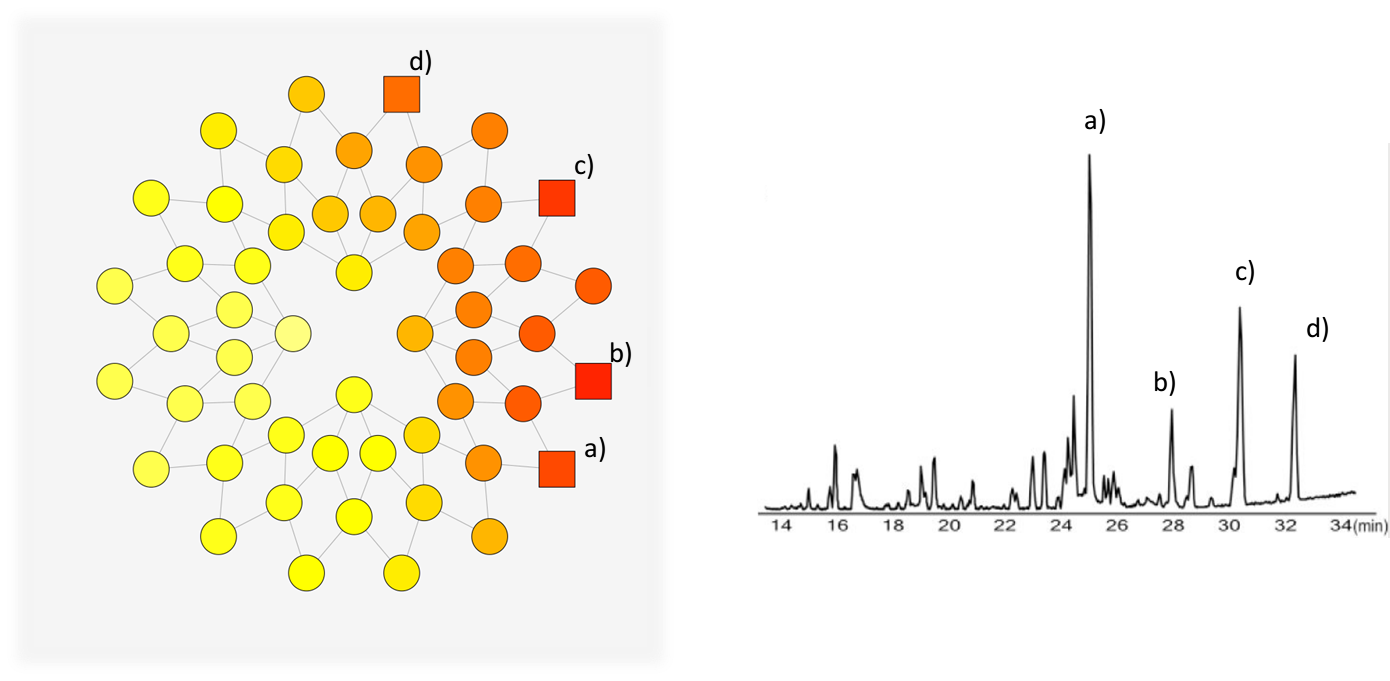
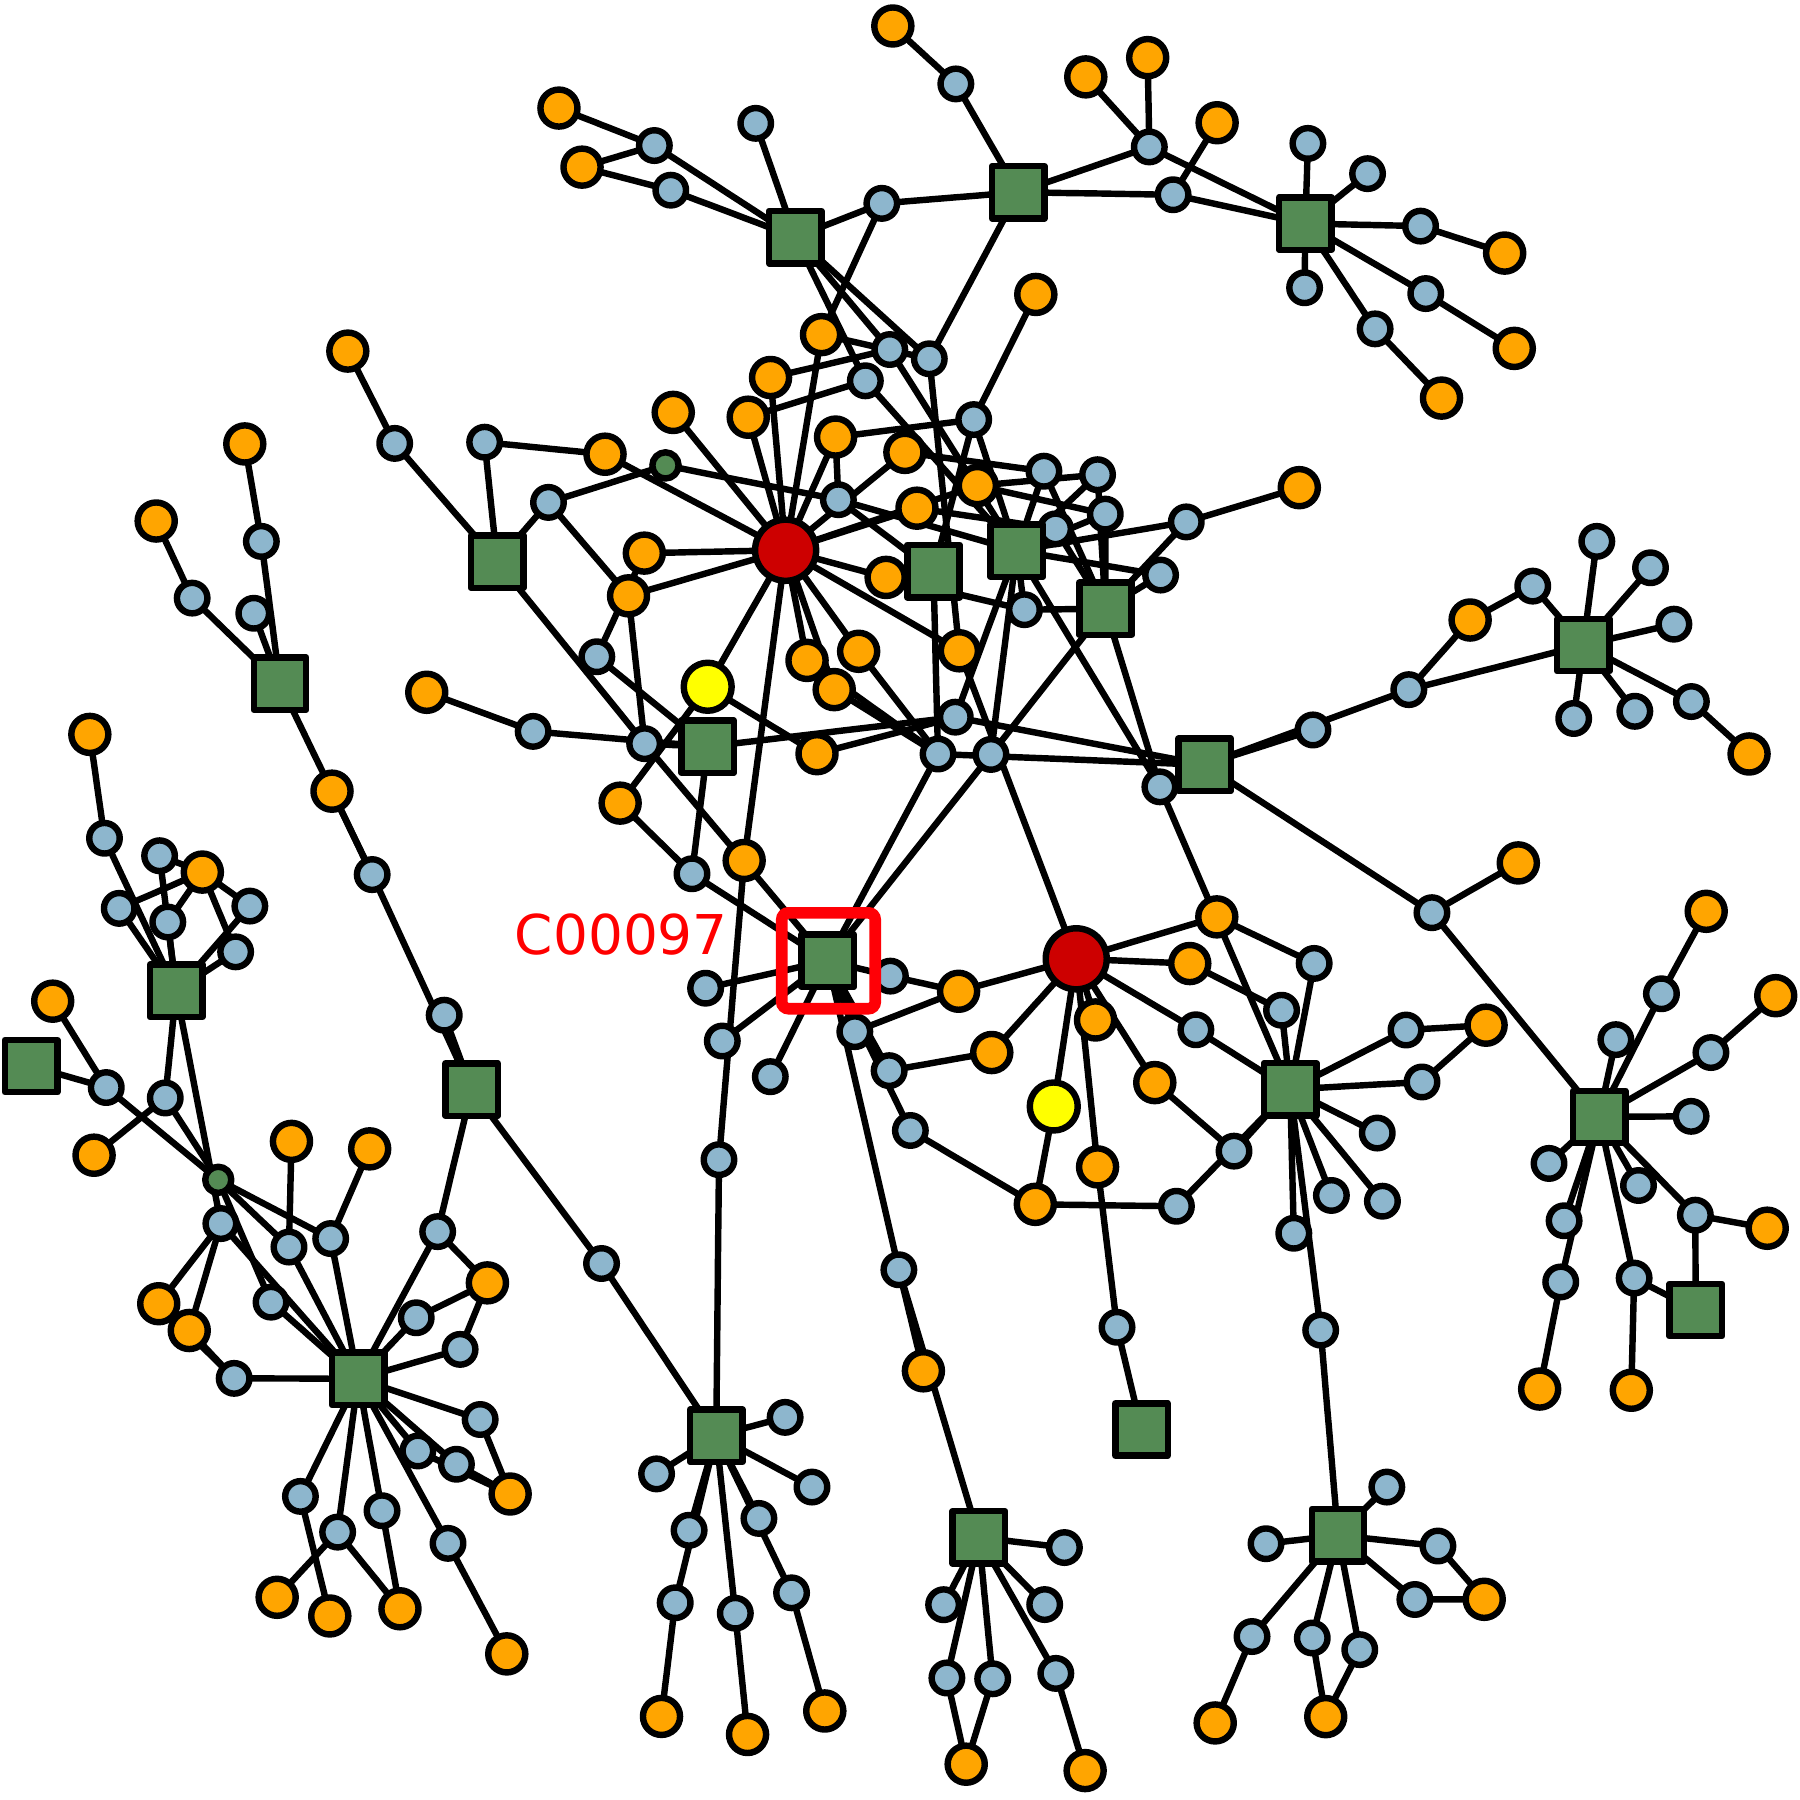
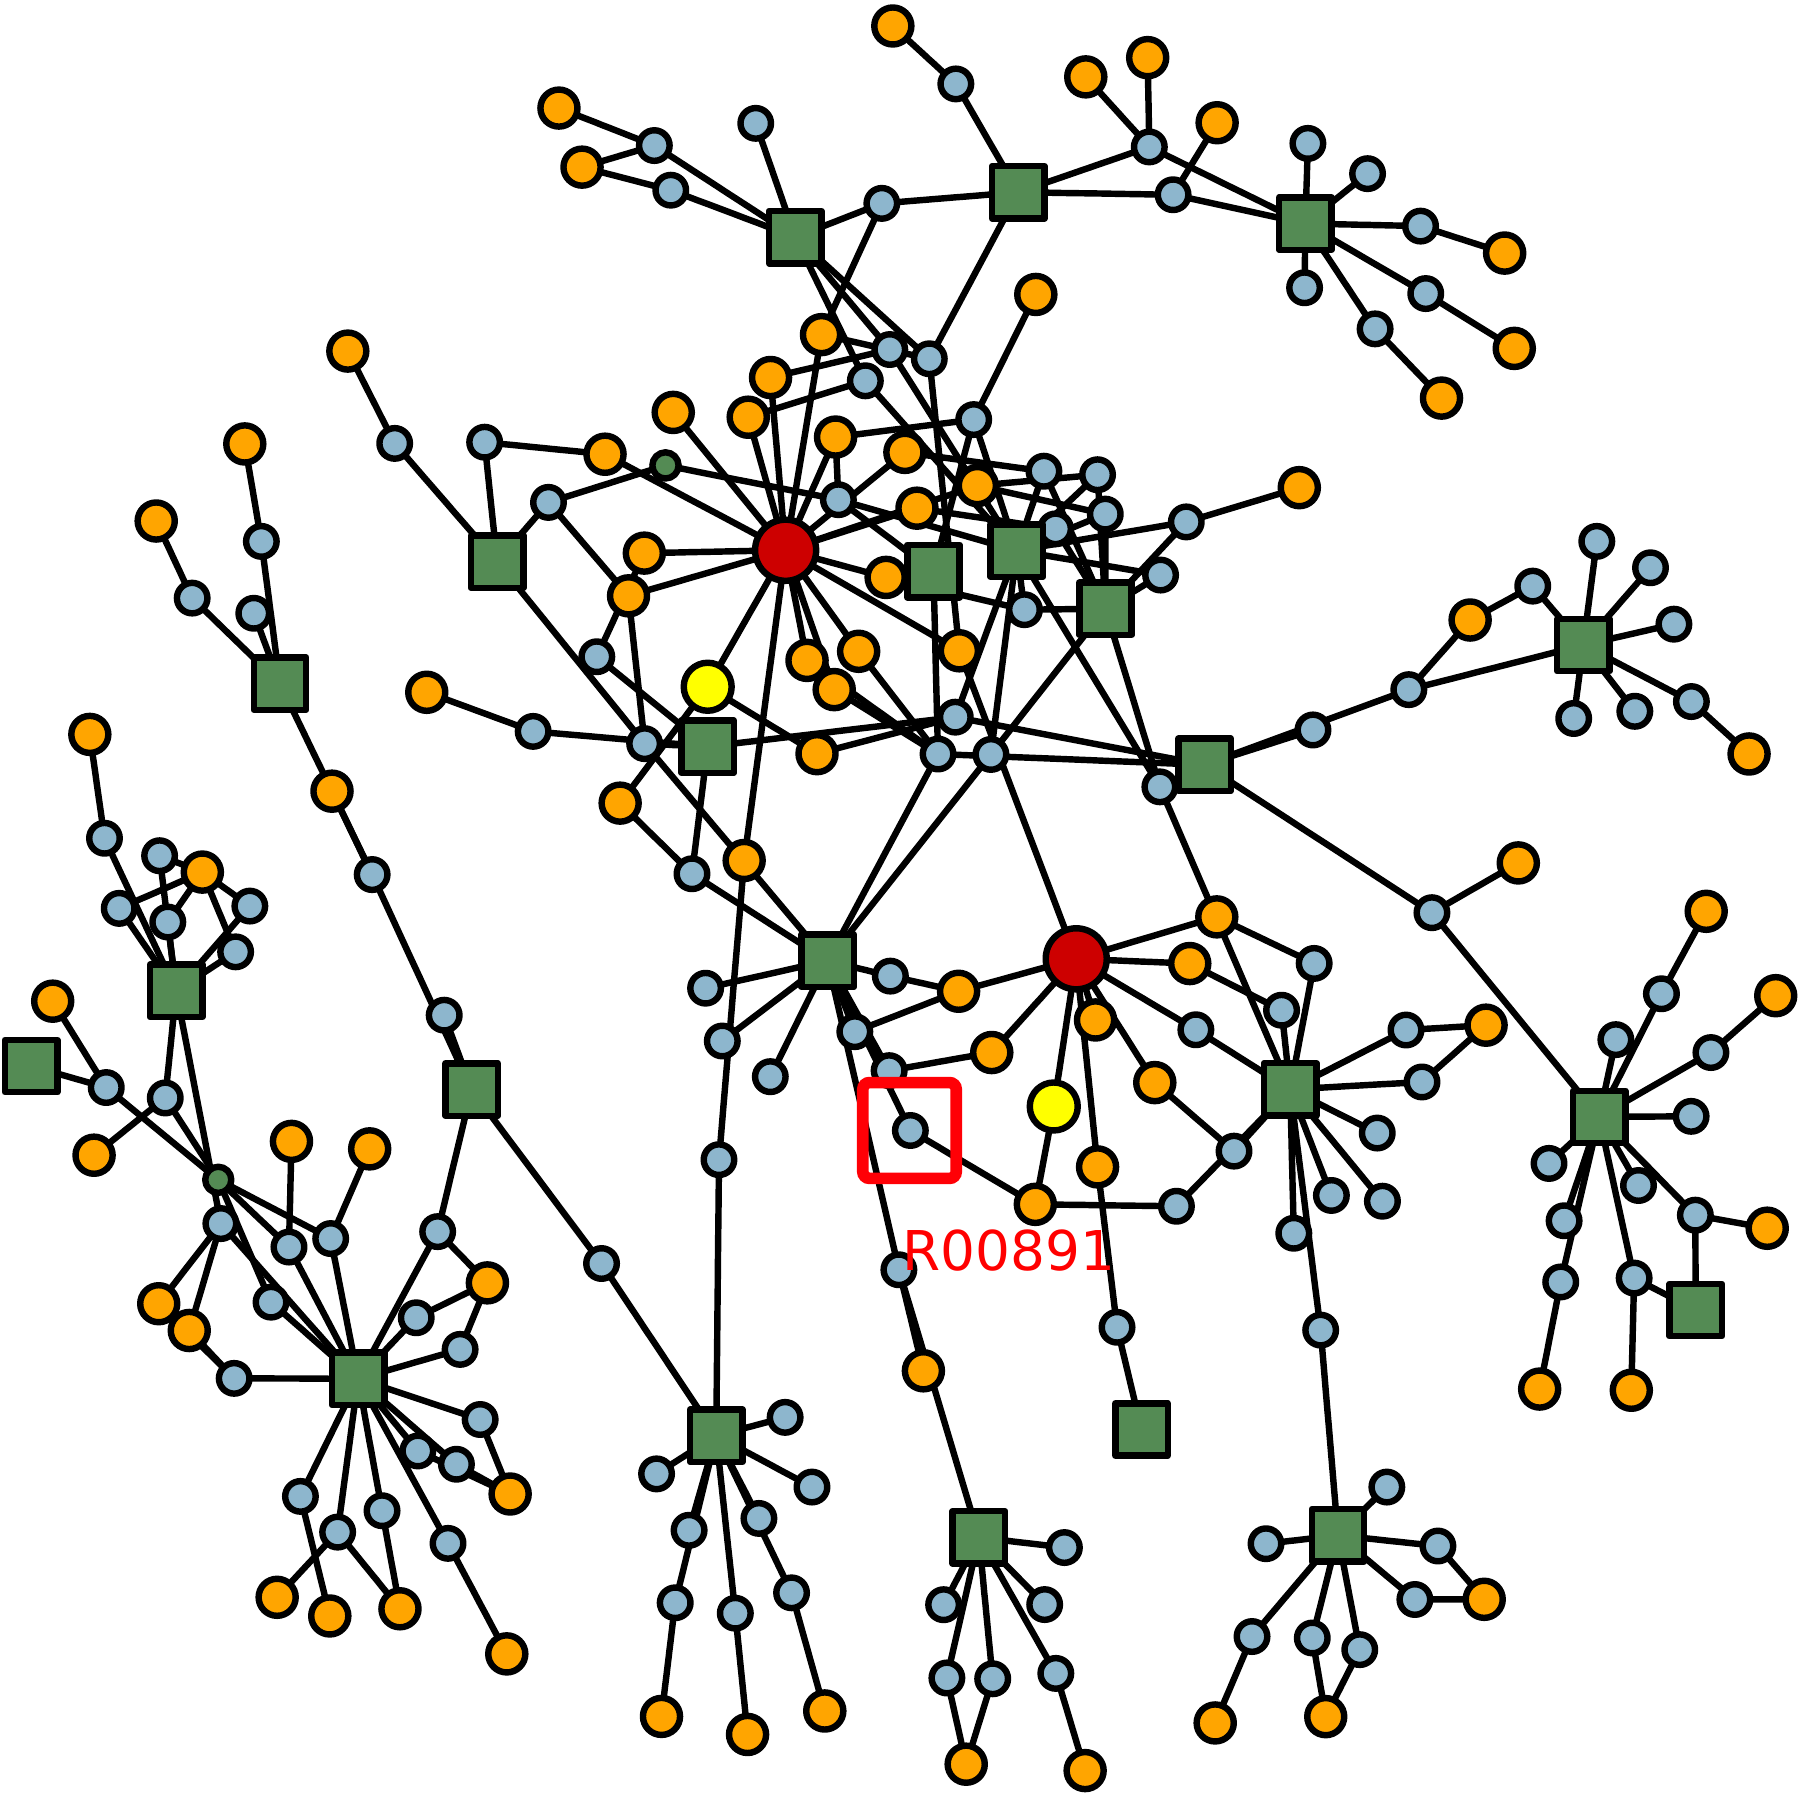
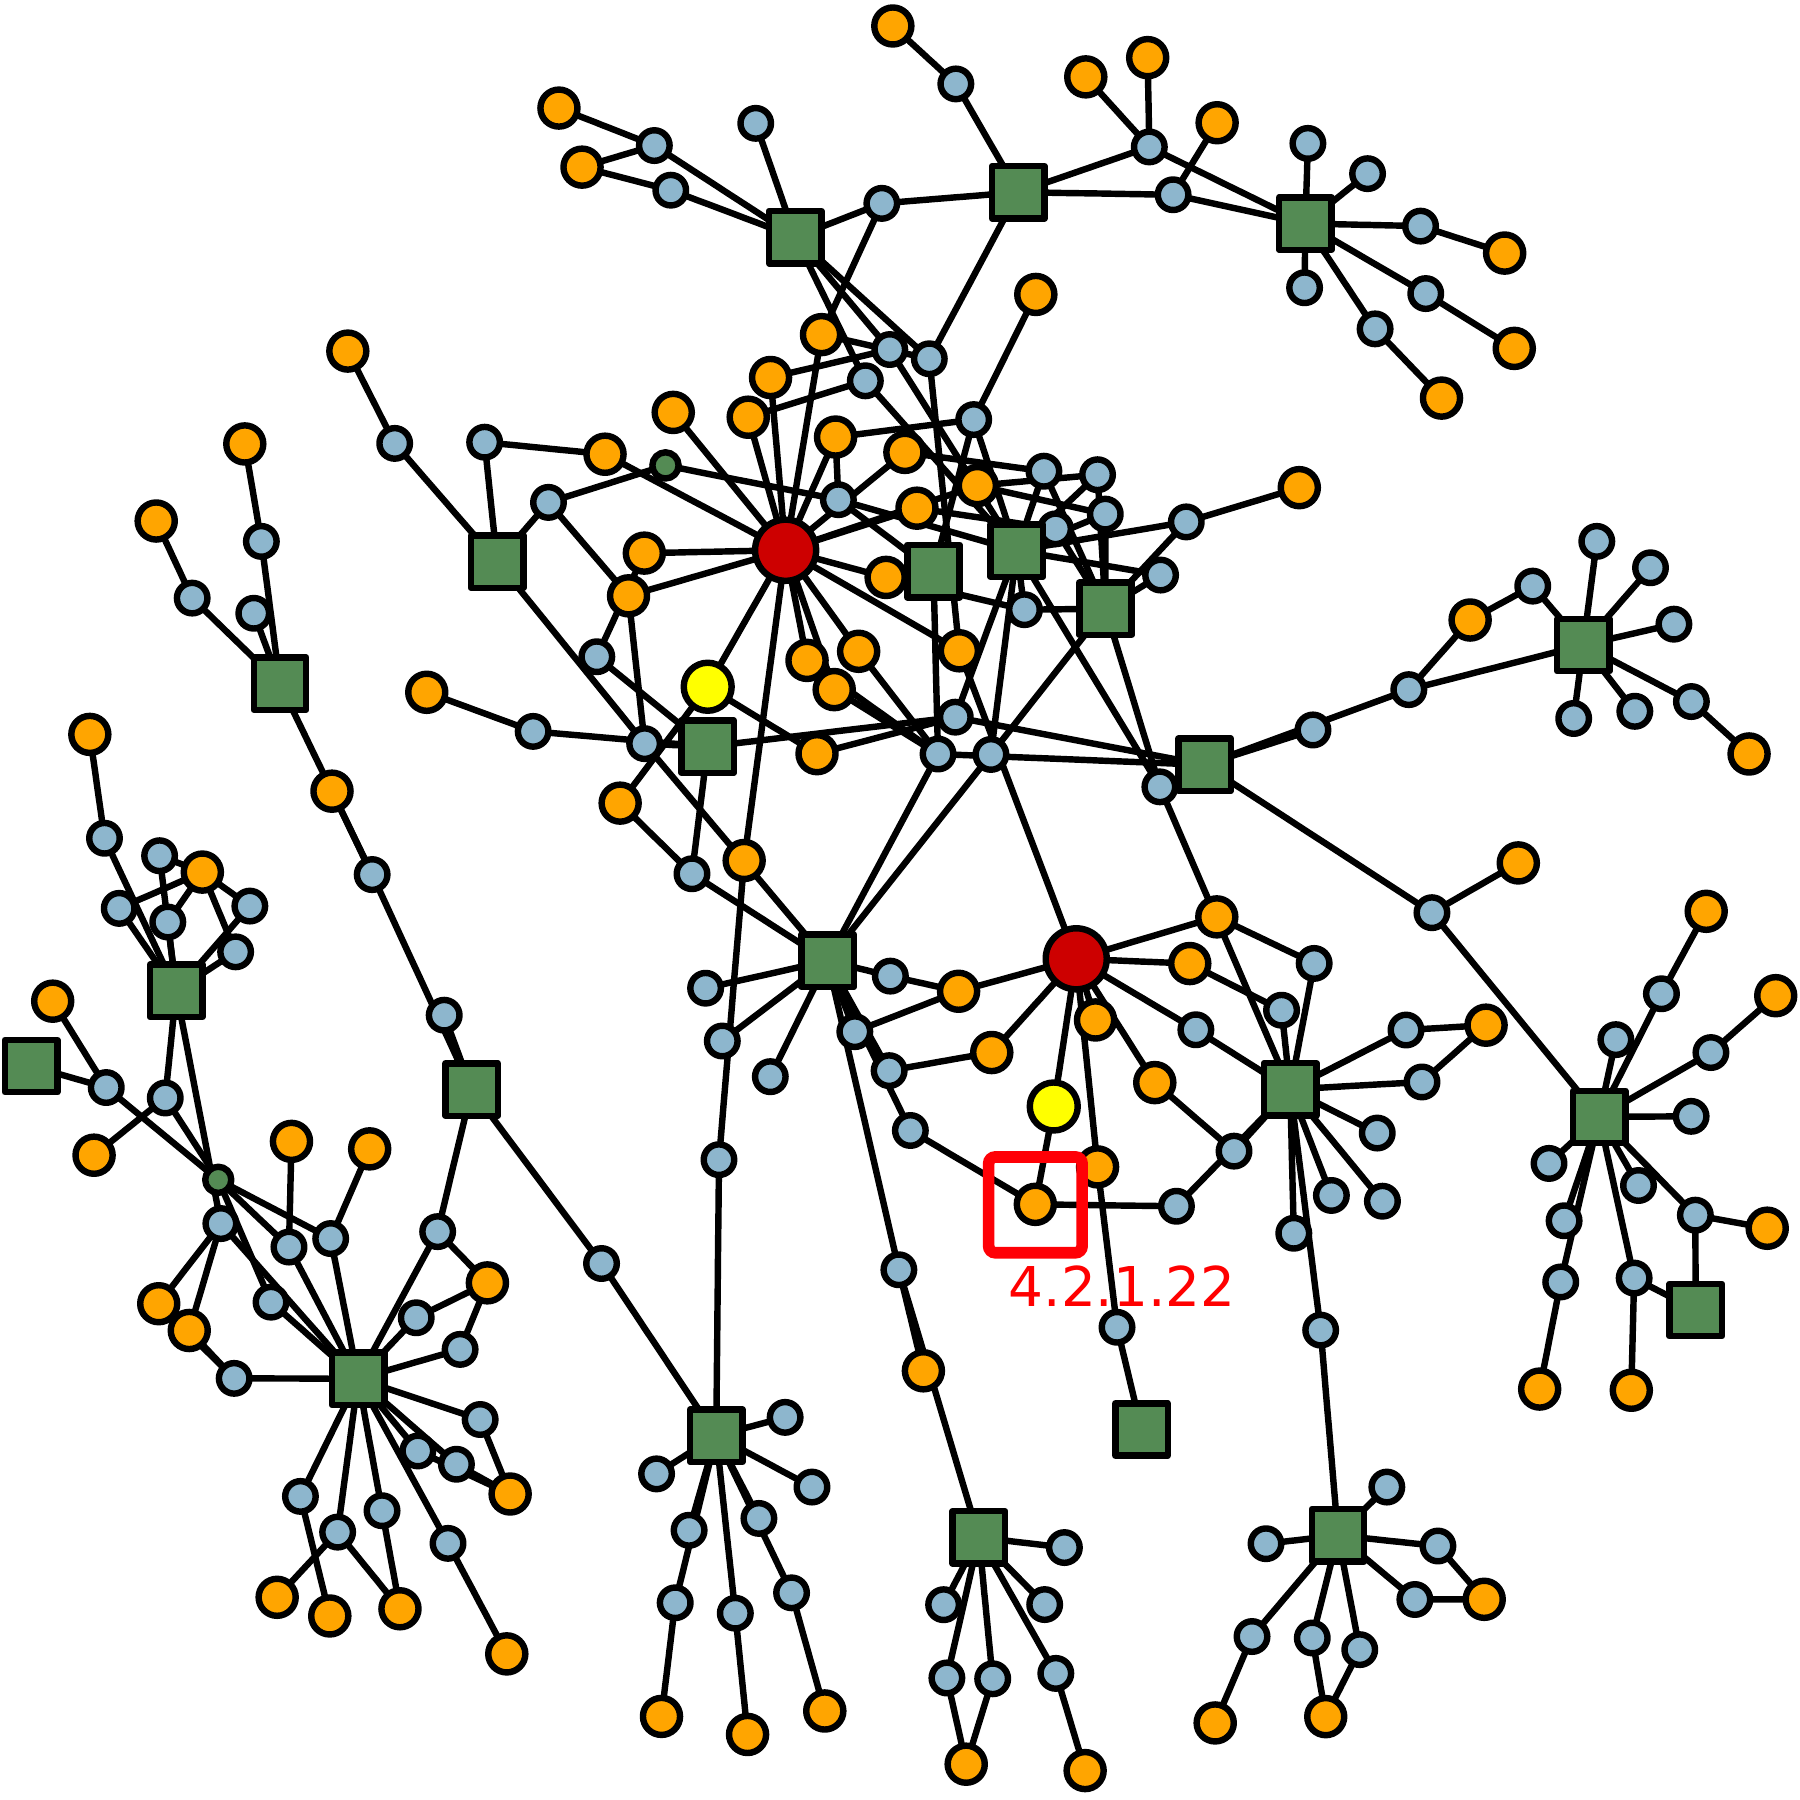
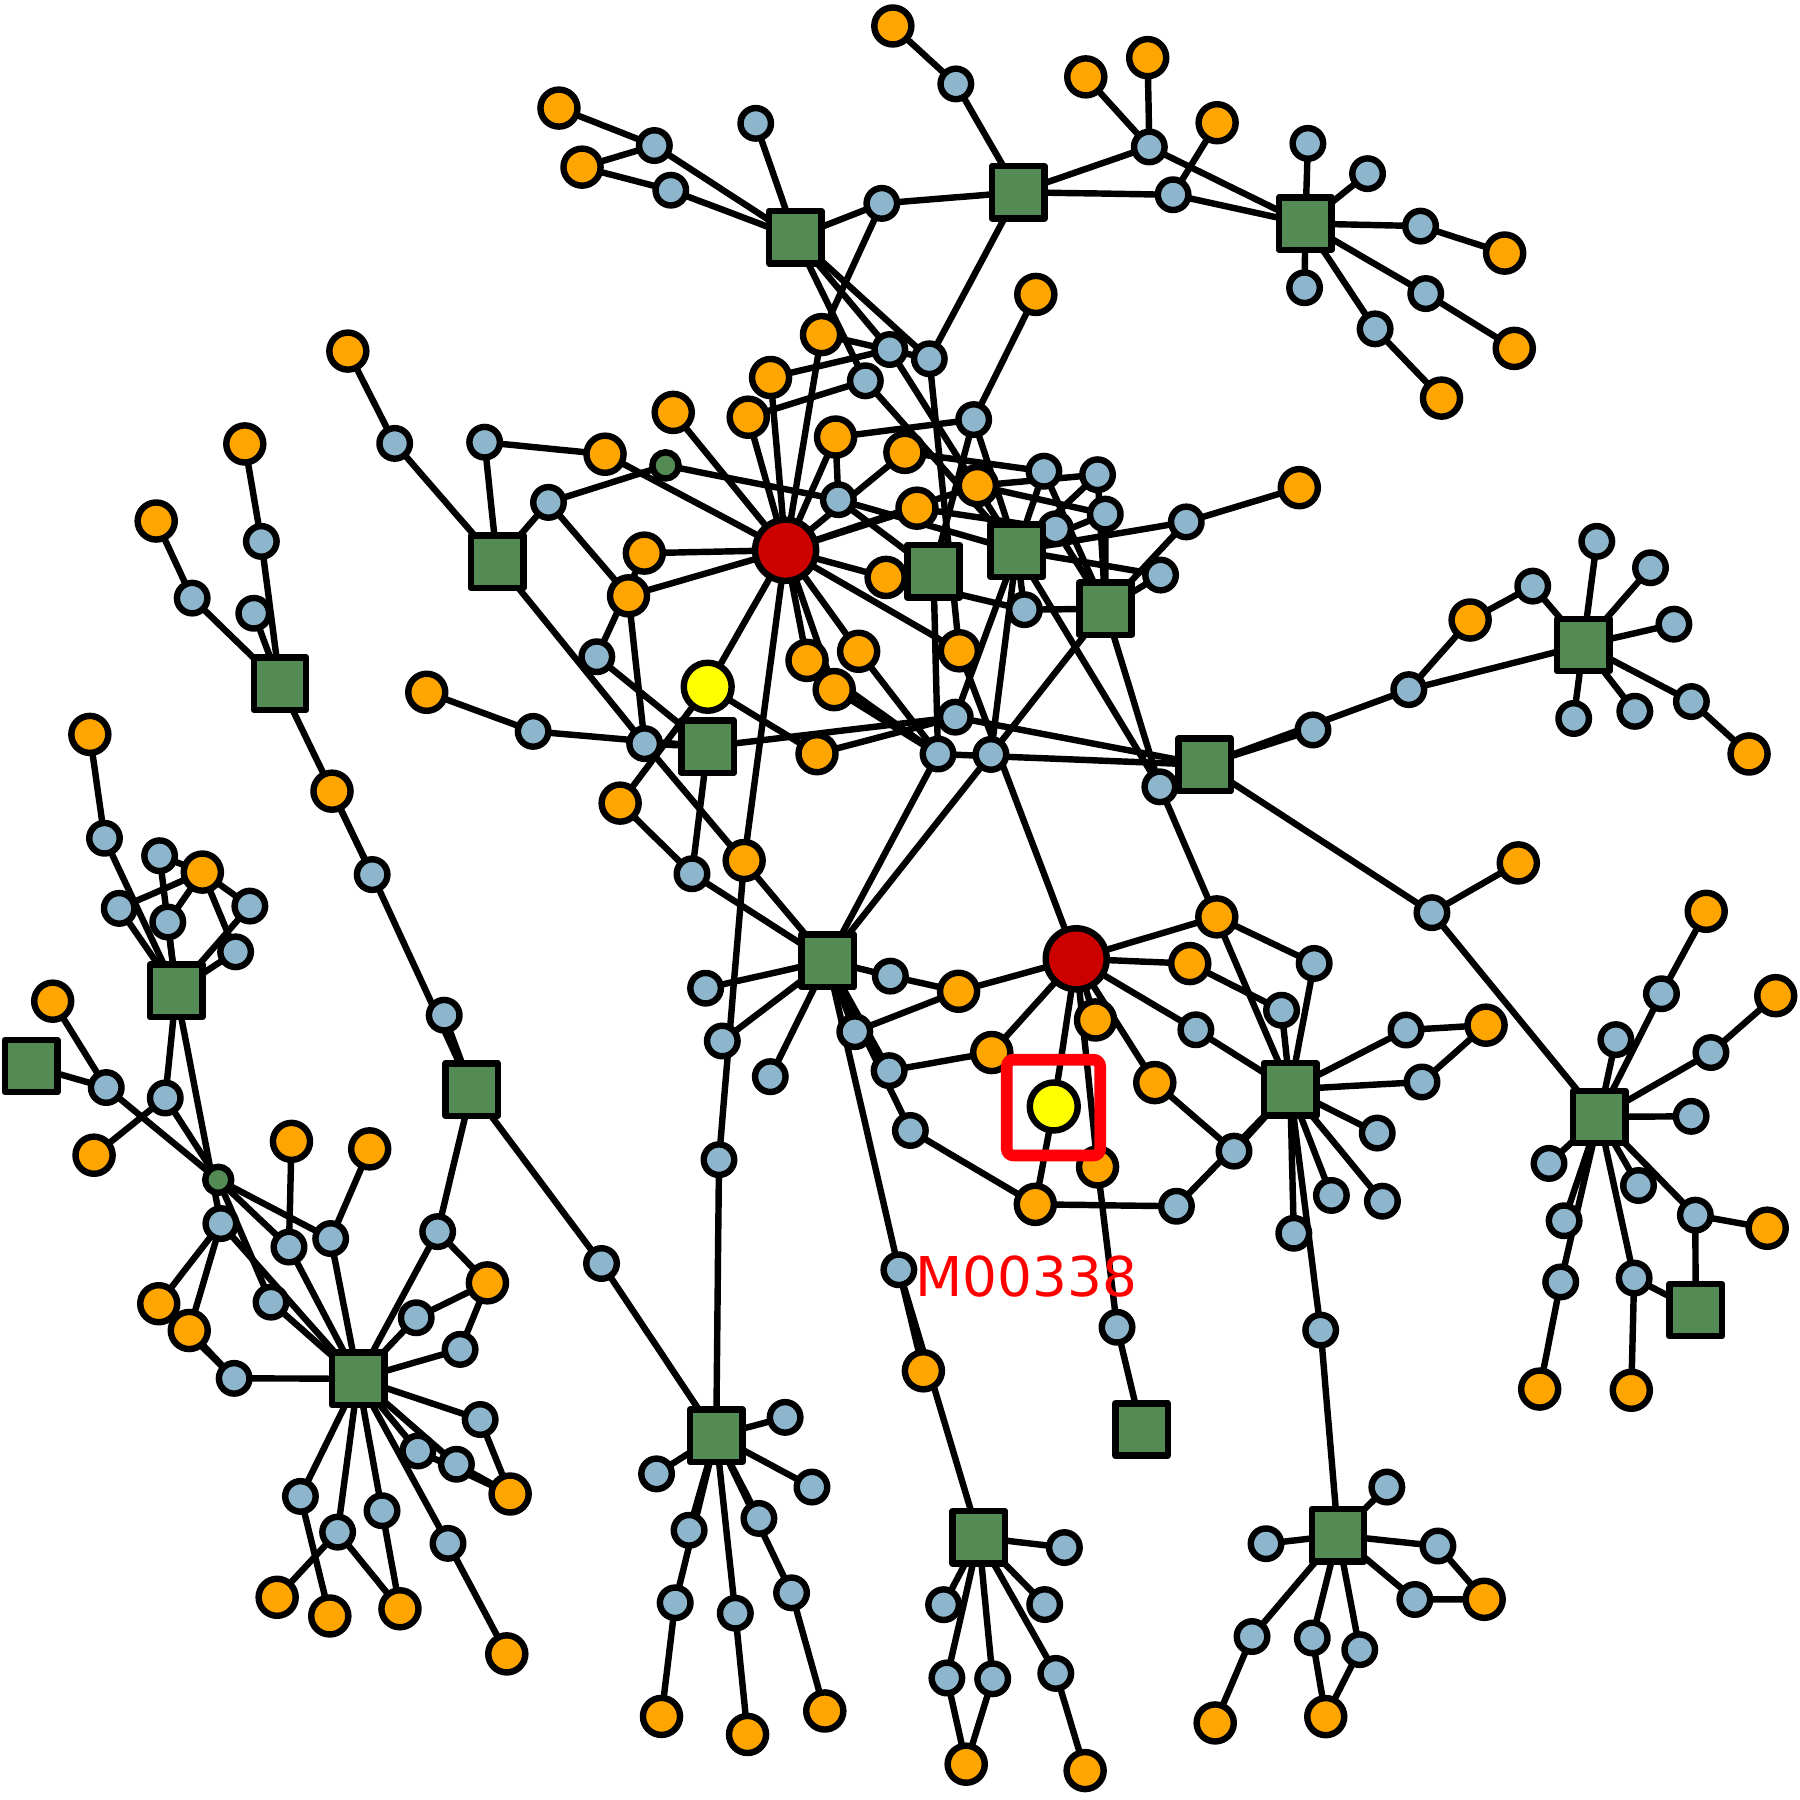
How can we find relevant parts of a graph? We will generate heat on certain nodes and analyse the hottest subgraph.
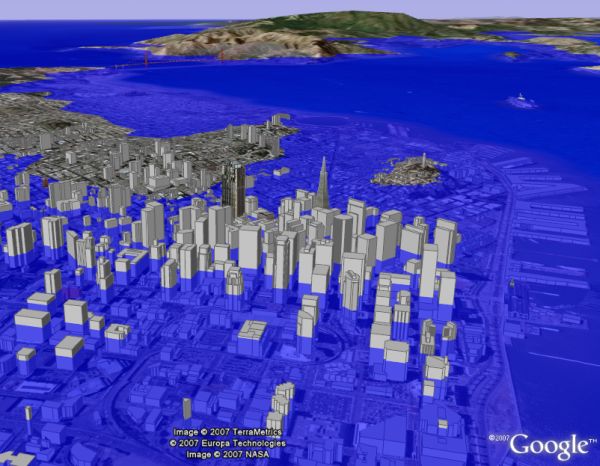
Heat diffusion in a meshed object. Image extracted from www.cd-adapco.com.
Diffusion on graphs (I) (2/2)
Heat diffusion in a graph: some nodes introduce heat to the structure.
Diffusion on graphs (II) (1/2)
Basics
We apply the finite difference formulation of the heat equation:
T^{n+1} = T^{n} + DTC \cdot [ KI \cdot T^{n} + KC \cdot TC + G ]
T^{k}
are the node temperatures in the k-th instant of time.
DTC
is a diagonal matrix relating the time step and heat capacities of the nodes.
KI
is the matrix containing the conductances between nodes.
Diffusion on graphs (II) (2/2)
KC
is the matrix containing the conductances between the nodes in the graph and the boundary nodes.
TC
are the temperatures of the boundary nodes.
G
is the inner heat generation of the graph nodes.
Input set
Input set
Null model (I)
Deterministic input
In this case, we know who the affected nodes are. Thus, we get a deterministic temperature:
T_{input} = R \cdot q
… but how can we know if a node is hot or not?
Temperatures are not explicative by themselves
Temperatures are not comparable between nodes
Random input
However, what happens if the input contains no signal, i.e. is random?
T_{null} = R \cdot X
Where X is a random variable that randomly selects compounds.
Null model (II)
Meaning of the null model
Analysing the distribution of temperatures for random cases allows the comparison between nodes in terms of their distributions. Is the temperature of node A as extreme as node B?
Statistical moments
We have determined the exact first and second moments of the temperature distributions:
The null sampling scheme, ties, and number of simulations matter. Adjust for the family of nodes tested.
Node-base test
Latent background (I)
Motivation
In practice, not all the nodes of interest can be measured. Technology only allow us to measure a subset of possible compounds in the database. Thus, there is a portion of nodes that introduce uncertainty. Assuming that they are not affected may be altering the results, depending on their amount…
Proposed solution
We suggest splitting a null model consisting of two parts:
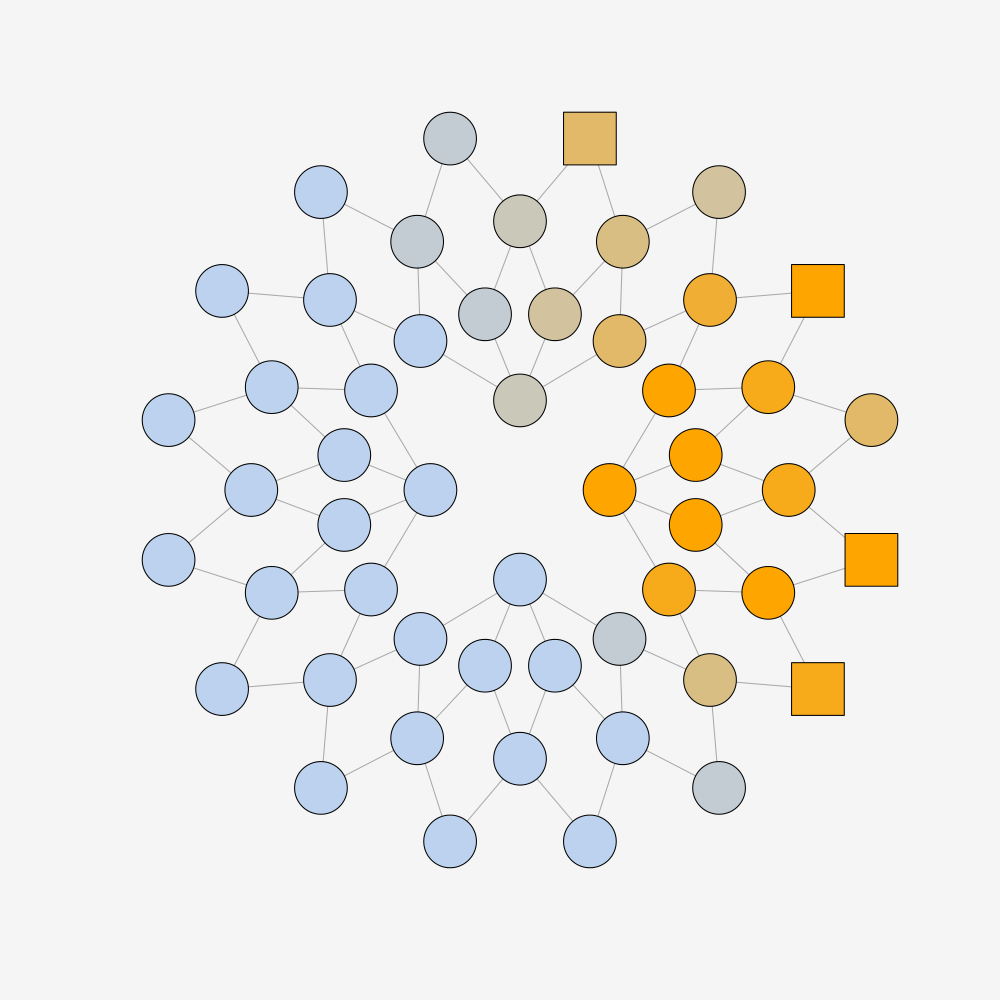
Observable pool: contains the nodes that can be measured. The affected nodes are a subset of the observable pool.
Latent pool: contains the nodes that cannot be measured through current technology.
We want to see how the presence of the latent pool modifies our statistical tests.
Assuming Latent Variance
Our original input
Assuming Latent Variance
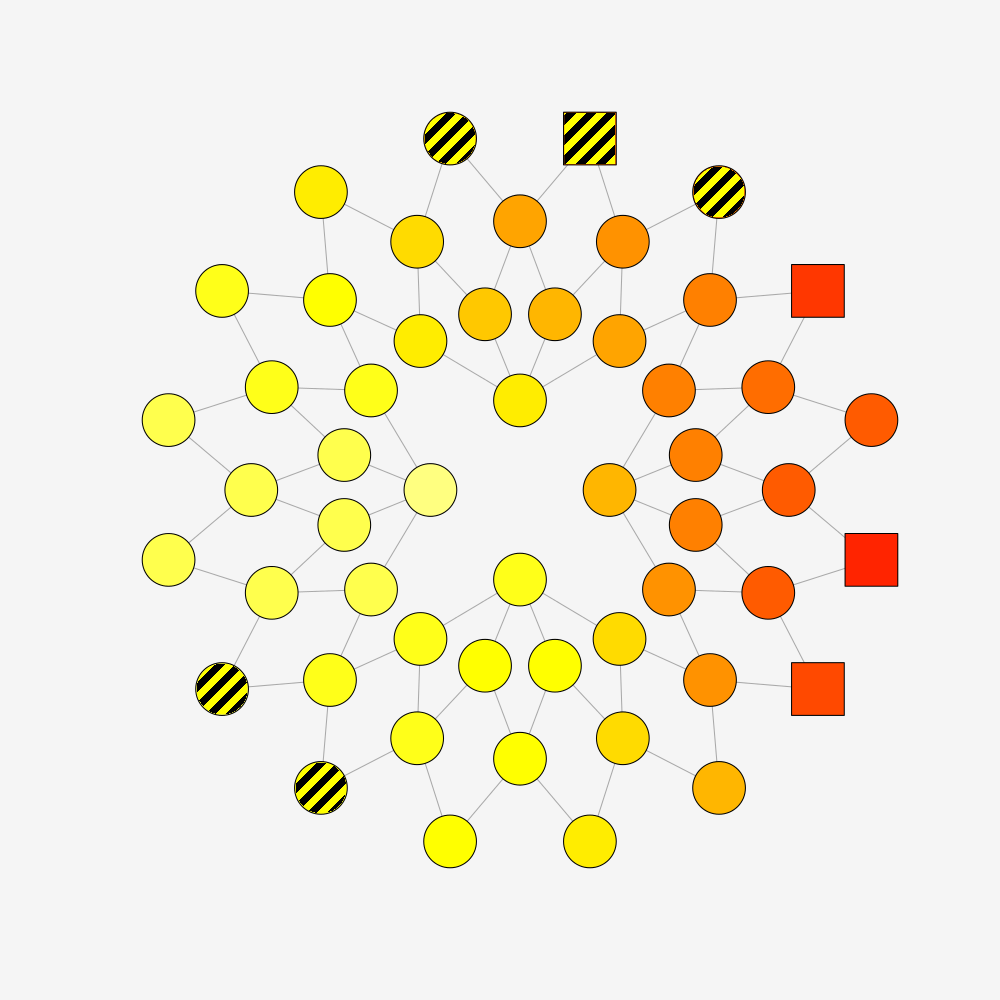
Barred nodes are not observable
Latent background (II)
Modification of statistical moments
We will call ALL the full model, OBS the observable model and LAT the latent model.
\mu_{ALL} \text{ remains unaffected}
\Sigma_{ALL} = \Sigma_{OBS} + 2\cdot \Sigma_{LAT}
Interpretation
By introducing the latent pool all the variances grow. The magnitude of this enlargement will assess how sensitive a particular node is to experimental uncertainty.
Assuming Latent Variance
Barred nodes are not observable
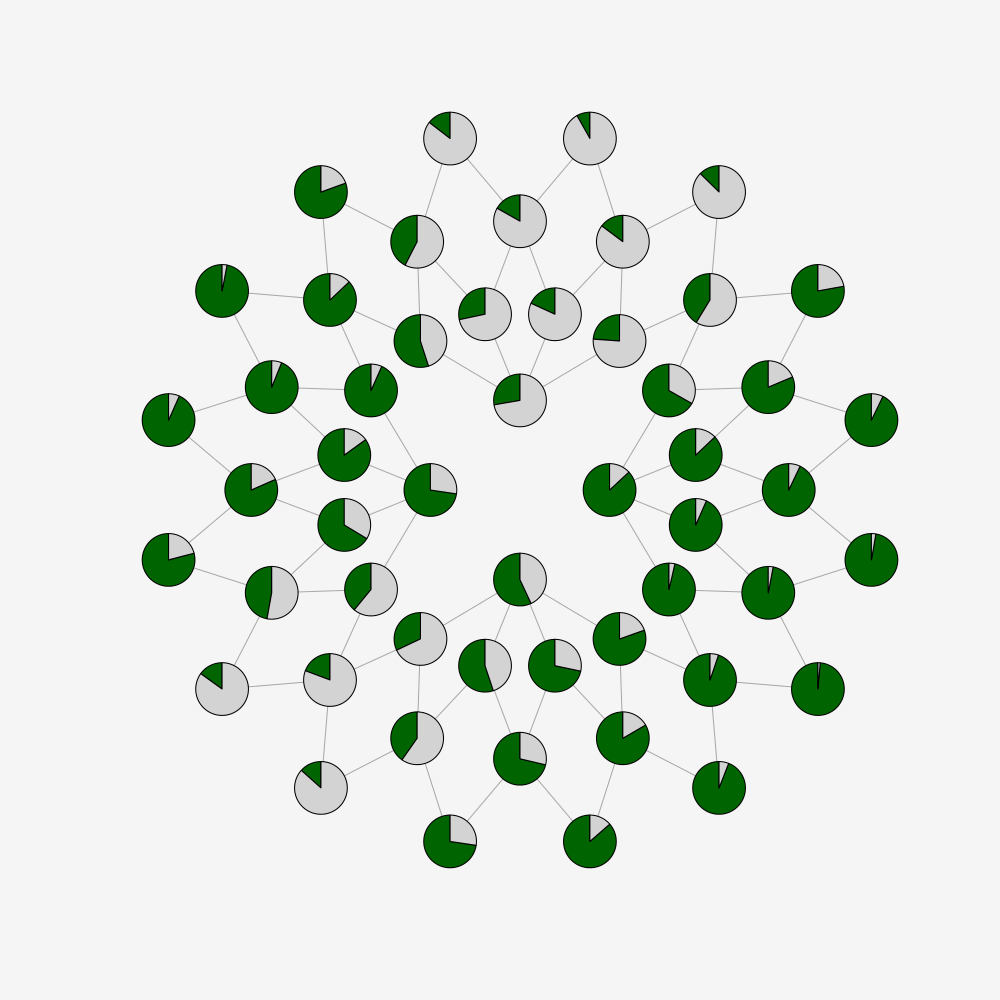
Proportion of variance explained by non-observability (red)
Assuming Latent Variance
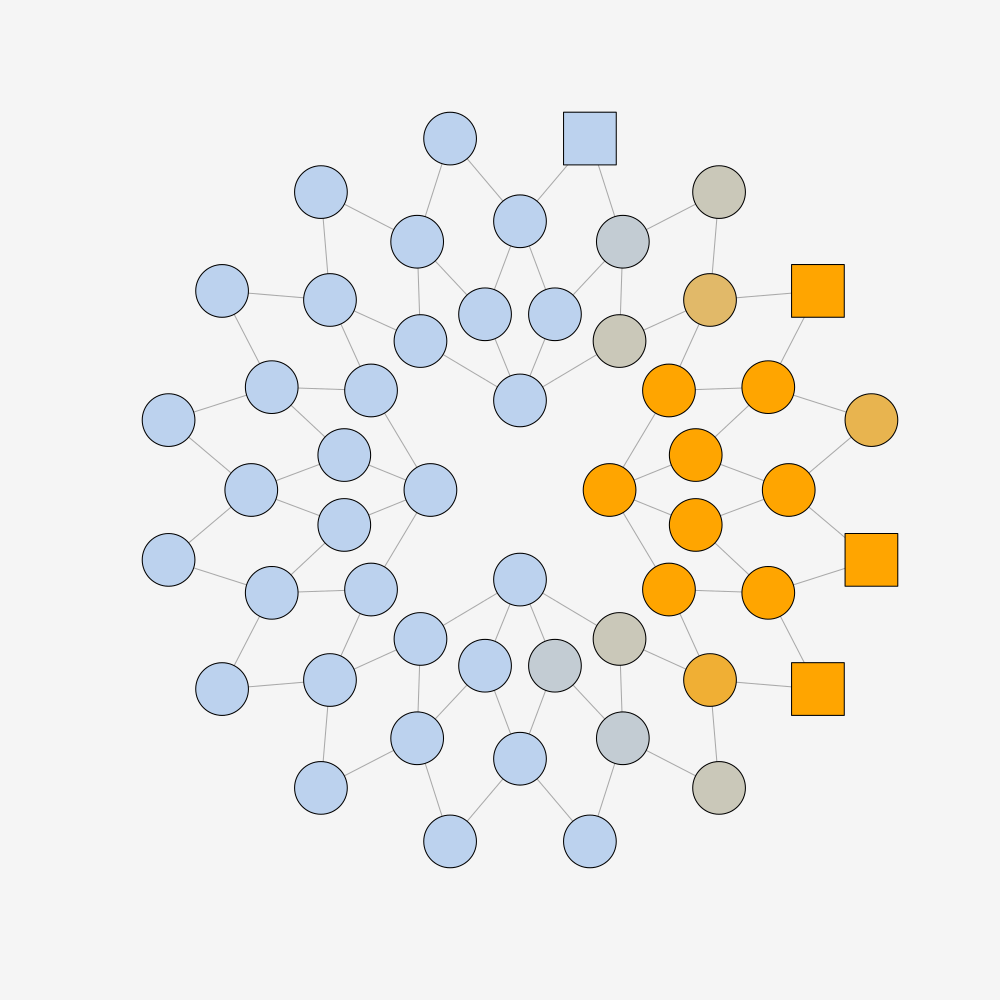
All graph is observable. Including the 5 non-observable nodes from the null model as non-affected (not fair)
Part of the graph is not observable. There is a compound which is affected but not observed by the experiment (fair statistics)
Null Heat Diffusion Model Test relevant nodes (1/6)
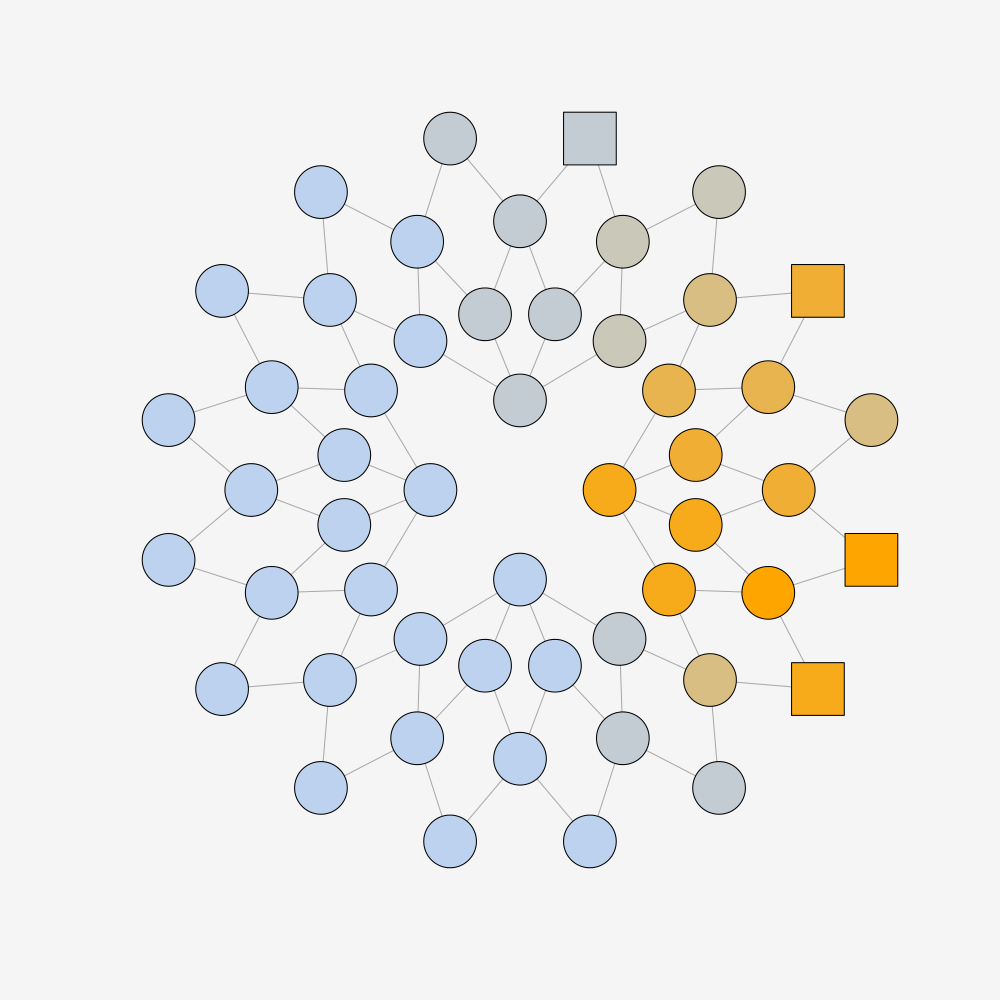
Relevant nodes interpretation.
Null Heat Diffusion Model Test relevant nodes (2/6)
Relevant nodes interpretation.
Null Heat Diffusion Model Test relevant nodes (3/6)
Relevant nodes interpretation.
Null Heat Diffusion Model Test relevant nodes (4/6)
Relevant nodes interpretation.
Null Heat Diffusion Model Test relevant nodes (5/6)
Relevant nodes interpretation.
Null Heat Diffusion Model Test relevant nodes (6/6)
Relevant nodes interpretation.
Heat Diffusion scores (1/4)
Pathway
Pathway description
T [ºC]
Related enzymes
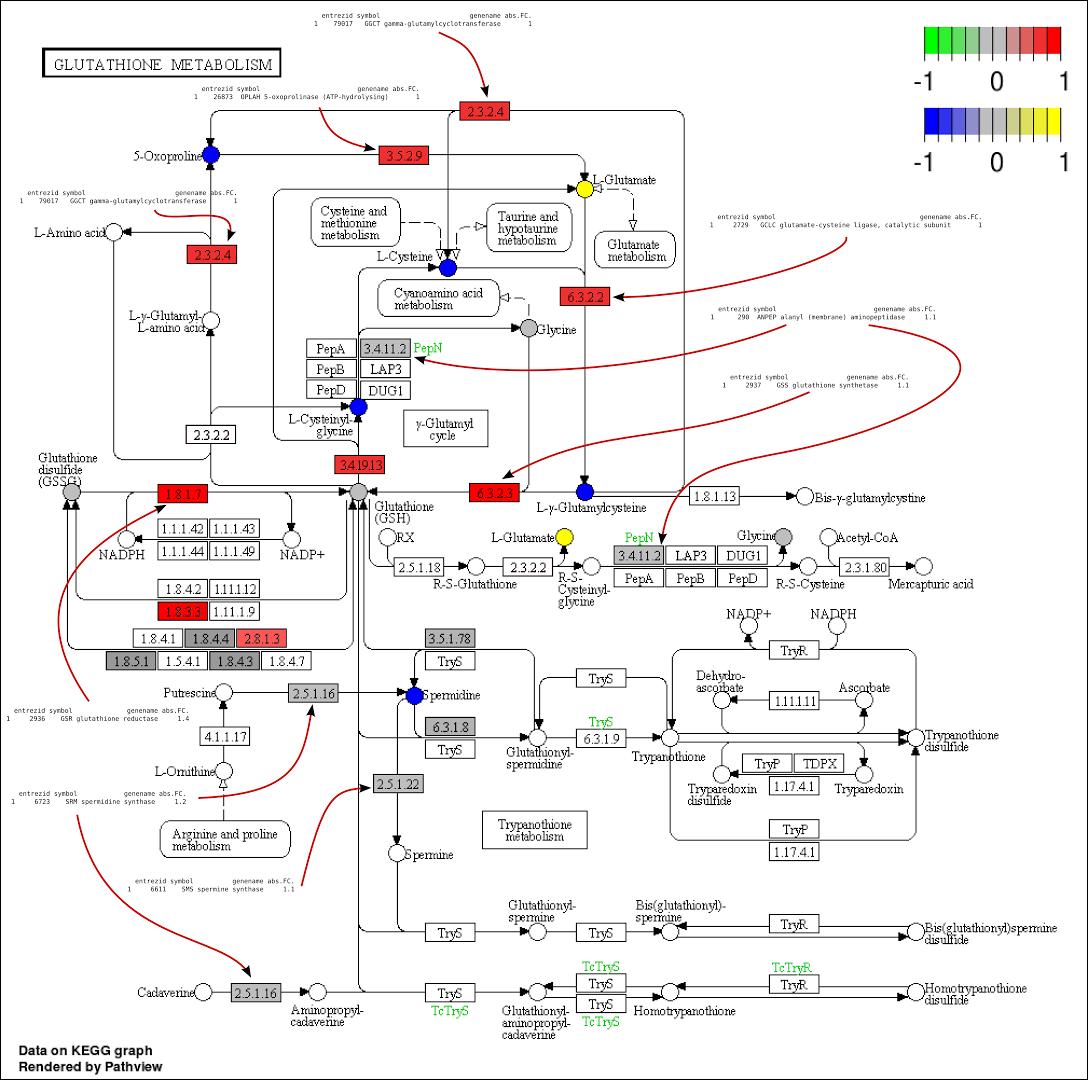
hsa00480
Glutathione metabolism
2.080
2.3.2.4 ; 1.8.1.13
hsa00330
Arginine and proline metabolism
1.458
2.3.1.1 ; 2.7.2.8
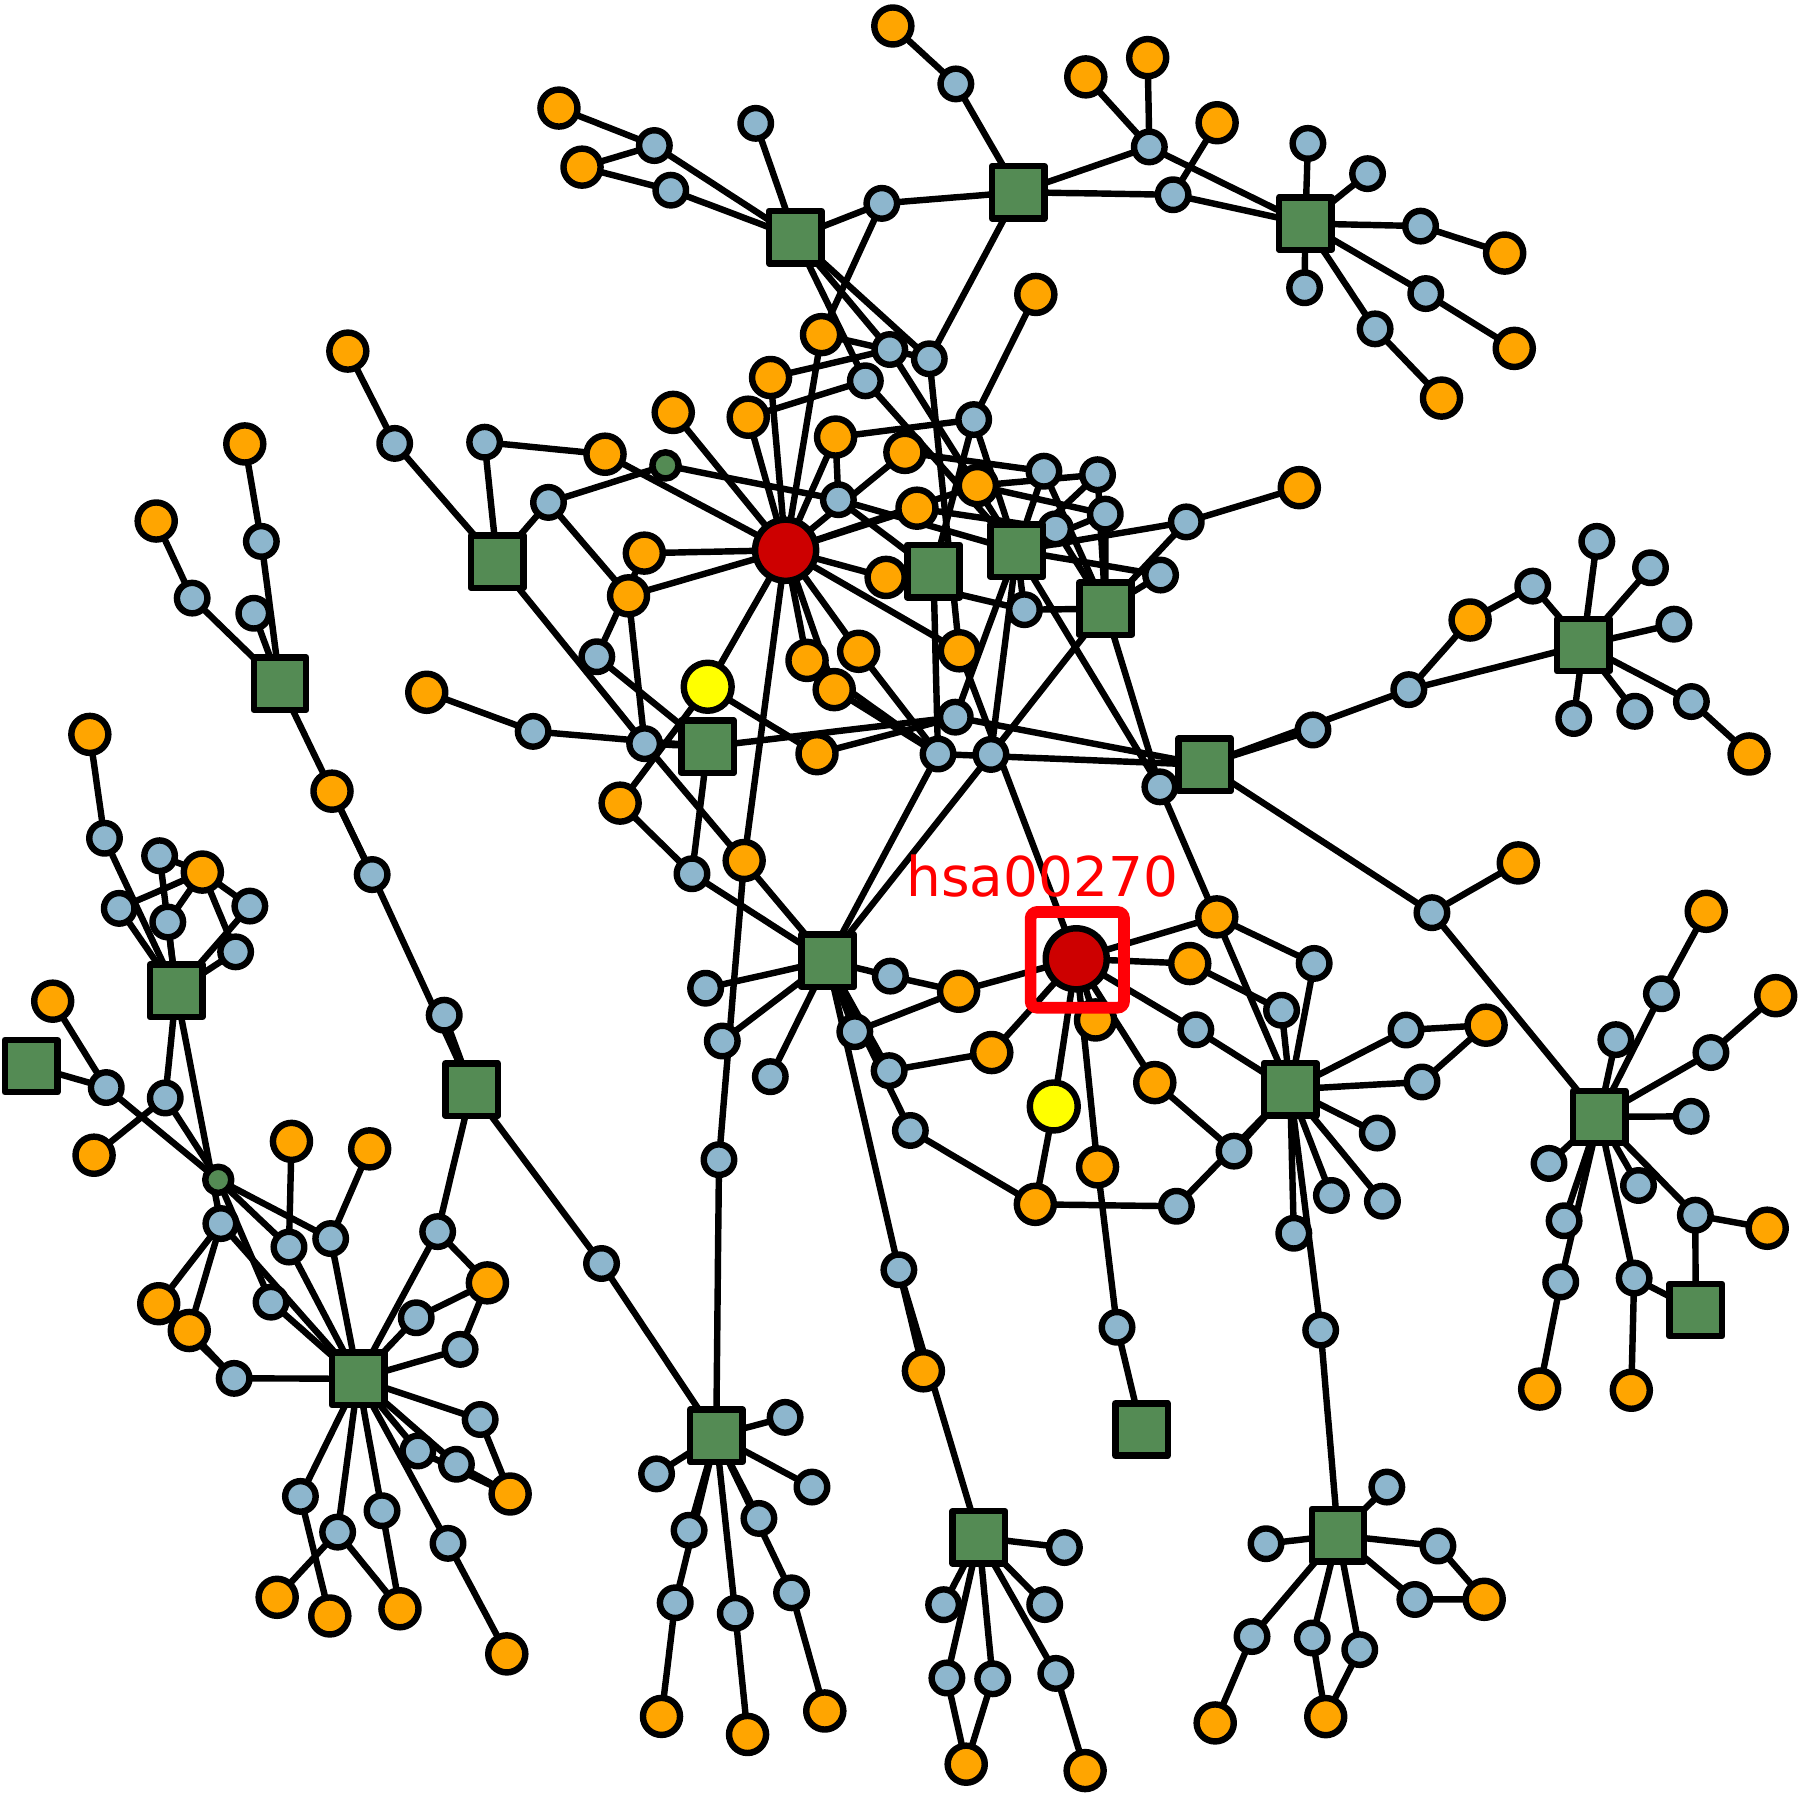
hsa00270
Cysteine and methionine metabolism
1.424
3.5.1.31 ; 1.8.4.1
hsa00564
Glycerophospholipid metabolism
1.317
3.1.1.5 ; 3.1.4.46
hsa01100
Metabolic pathways
1.231
2.3.1.1 ; 6.3.2.3
Heat Diffusion scores (2/4)
Pathway
Pathway description
T [ºC]
Related enzymes
hsa00250
Alanine, aspartate and glutamate metabolism
1.226
2.3.1.17 ; 3.5.1.15
hsa00770
Pantothenate and CoA biosynthesis
1.225
2.7.1.33 ; 3.5.1.22
hsa00600
Sphingolipid metabolism
1.205
3.2.1.18 ; 3.1.4.41
hsa00920
Sulfur metabolism
1.158
4.4.1.2 ; 2.5.1.48
hsa00520
Amino sugar and nucleotide sugar metabolism
1.156
2.7.7.43 ; 4.1.3.3
Heat Diffusion scores (3/4)
HD algorithm on LIN UCG and 10ºC boundary.
Pathway
Pathway description
T [ºC]
Related enzymes
hsa00500
Starch and sucrose metabolism
1.135
2.4.1.1 ; 2.4.1.17
hsa00360
Phenylalanine metabolism
1.128
1.1.1.222 ; 1.1.1.237
hsa00260
Glycine, serine and threonine metabolism
1.117
1.2.1.31 ; 1.1.1.95
hsa00410
beta-Alanine metabolism
1.115
1.2.1.31 ; 2.5.1.16
hsa00650
Butanoate metabolism
1.103
1.1.99.2 ; 2.8.3.12
Heat Diffusion scores (4/4)
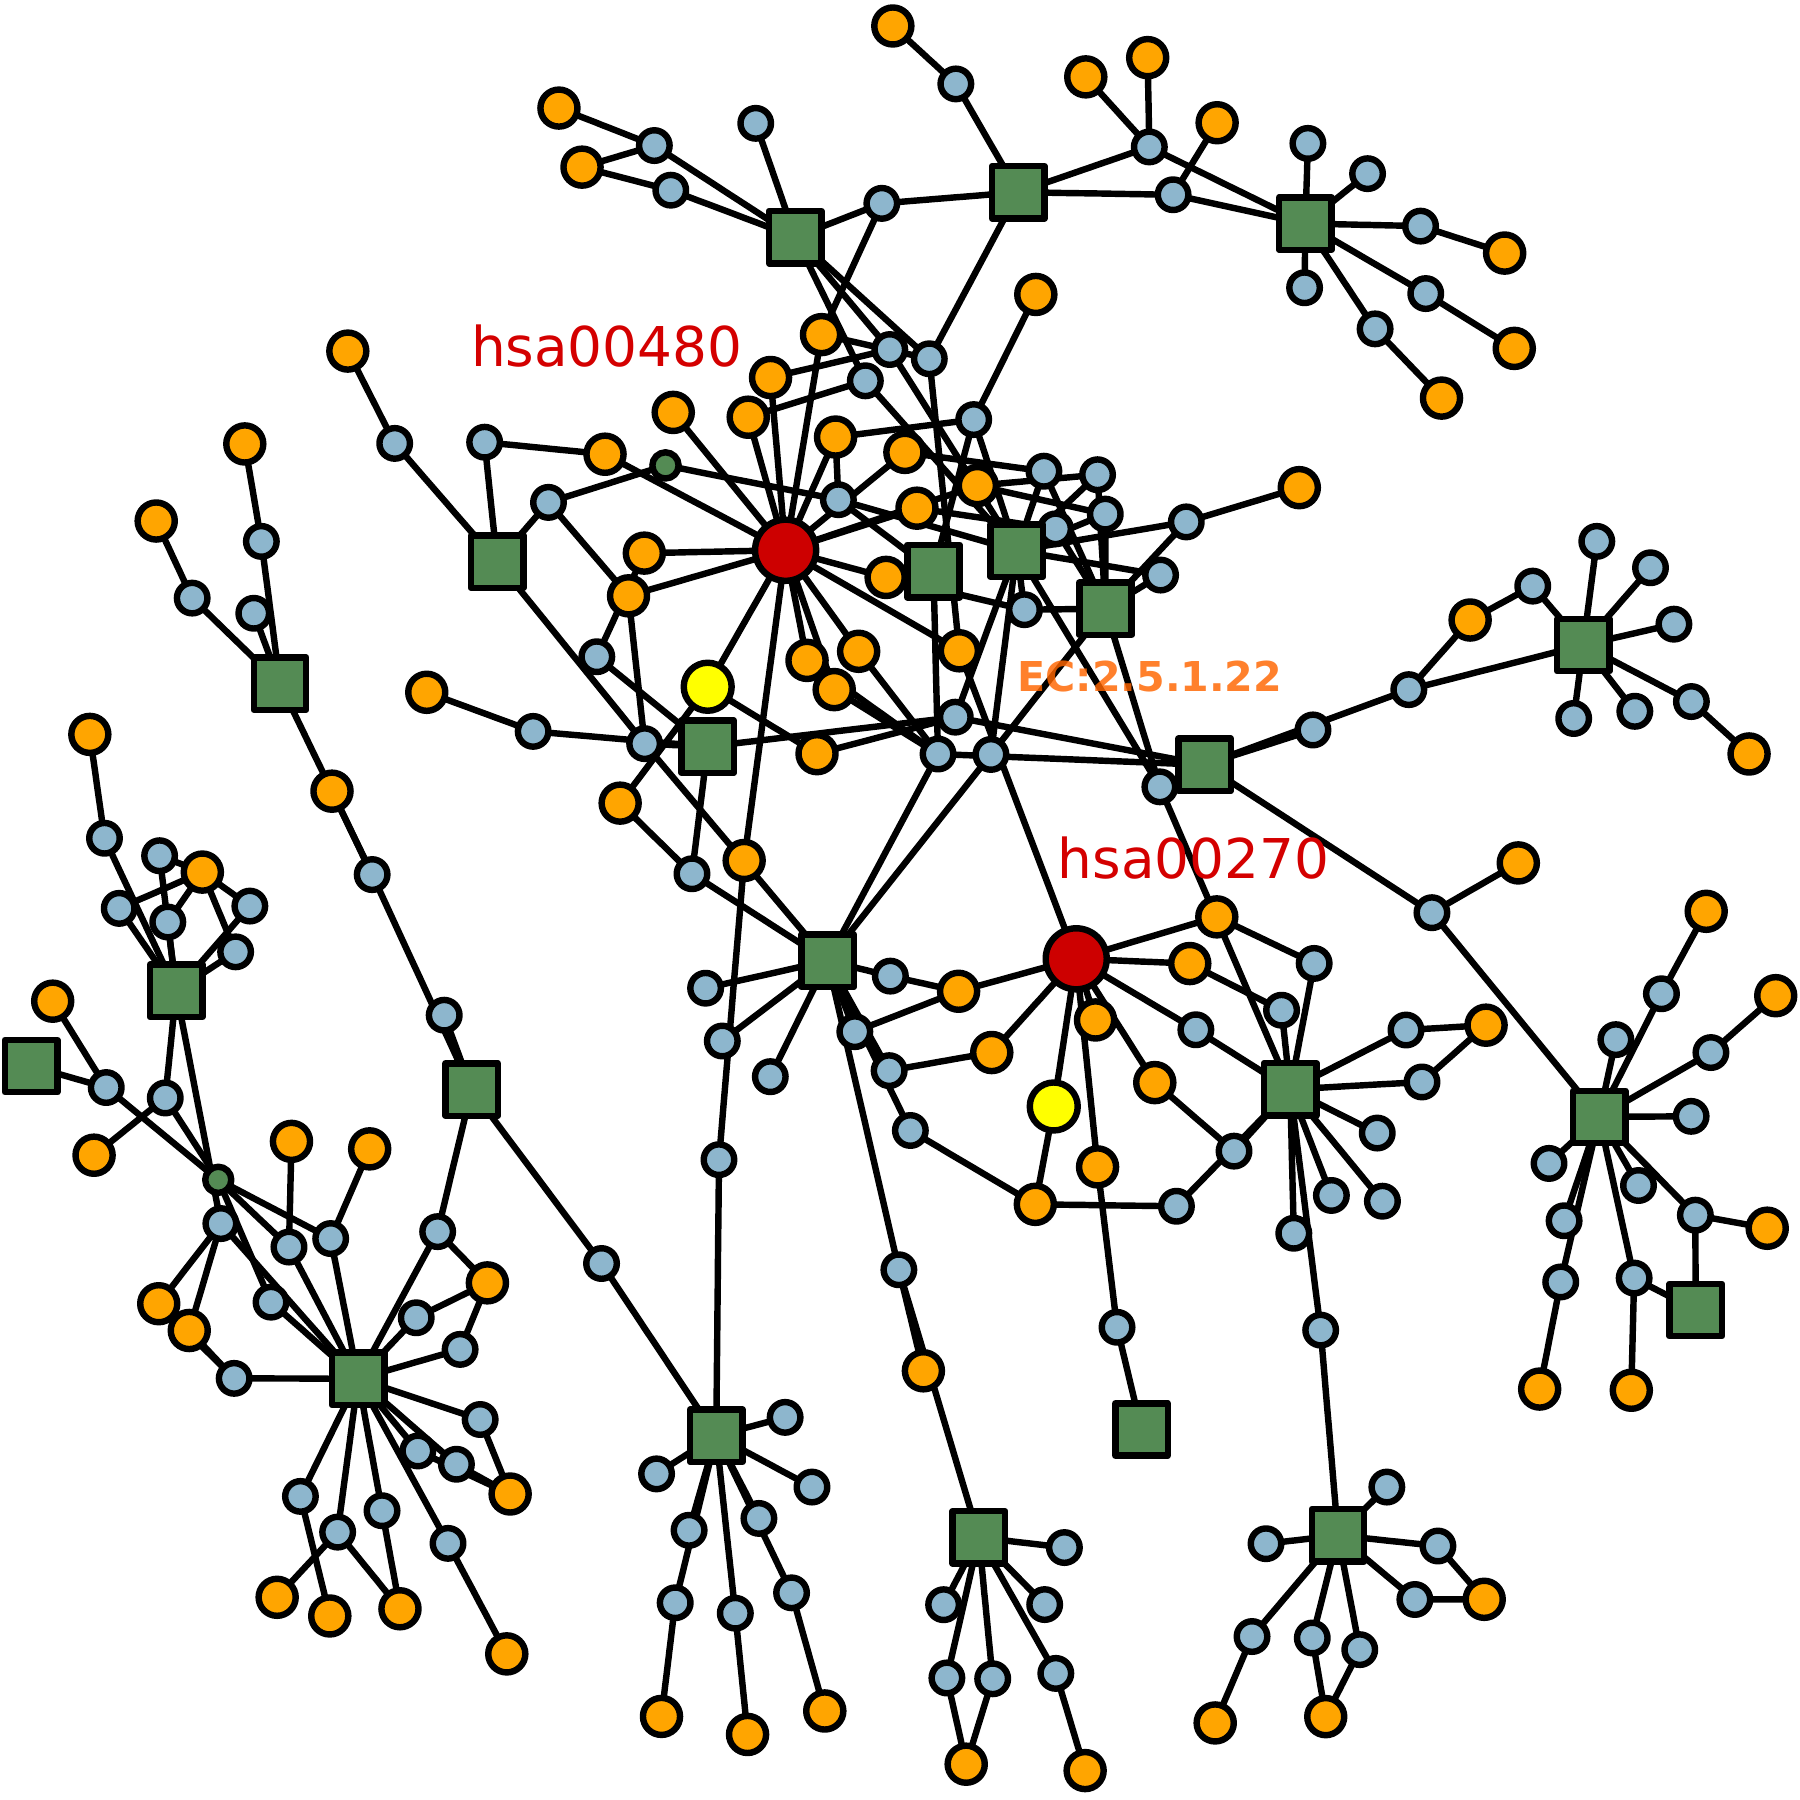
Glutathione metabolism involvement has been validated through isotope tagging at Center for Omics Sciences (Dr. Yanes, YanesLab http://www.yaneslab.com)
Validation
About b2slab.upc.edu
Collaborators in the source edition (1/5)
Takeda Cambridge Ltd.
Collaborators in the source edition (2/5)
COS
Centre for Omic Sciences (COS), Rovira i Virgili University, Avinguda Universitat 1, 43204 Reus, Spain (Dr. Oscar Yanes)
Collaborators in the source edition (3/5)
Mental Health Center Sct. Hans, Roskilde, Denmark (Dr. Buil)
Collaborators in the source edition (4/5)
The Biomarkers and Nutritional & Food Metabolomics research group from the Department of Nutrition and Food Science of the University of Barcelona (Dr. Rafael Llorach and Dr. Cristina Andrés-Lacueva)
Collaborators in the source edition (5/5)
Genomic Instability and Cancer Laboratory (Dr. Travis Stracker)
About Us b2slab.upc.edu
Questions are welcome
References
References are cited with the relevant figures and methods. Full bibliographic details follow.
References (1)
Tian, Zhang, He et al. (2014). An organ boundary-enriched gene regulatory network uncovers regulatory hierarchies underlying axillary meristem initiation. Molecular systems biology.
Booth, Weljie, Turner (2013). Computational tools for the secondary analysis of metabolomics experiments. Computational and structural biotechnology journal.
References (2)
Ogata, Goto, Sato et al. (1999). KEGG: Kyoto Encyclopedia of Genes and Genomes.. Nucleic Acids Research. Source
Szklarczyk, Franceschini, Wyder et al. (2015). STRING v10: protein-protein interaction networks, integrated over the tree of life.. Nucleic Acids Research. Source
References (3)
Consortium (2015). UniProt: a hub for protein information. Nucleic Acids Research. Source
Ashburner, Ball, Blake et al. (2000). Gene Ontology: Tool for the unification of biology. Nature Genetics.
References (4)
Kamburov, Cavill, Ebbels et al. (2011). Integrated pathway-level analysis of transcriptomics and metabolomics data with IMPaLA.. Bioinformatics. Source
Subramanian, Tamayo, Mootha et al. (2005). Gene set enrichment analysis: A knowledge-based approach for interpreting genome-wide expression profiles. Proceedings of the National Academy of Sciences. Source
References (5)
Xia, Wishart (2010). MSEA: a web-based tool to identify biologically meaningful patterns in quantitative metabolomic data.. Nucleic Acids Research. Source
Xia, Wishart (2010). MetPA: a web-based metabolomics tool for pathway analysis and visualization.. Bioinformatics. Source
References (6)
Xia, Mandal, Sinelnikov et al. (2012). MetaboAnalyst 2.0 - a comprehensive server for metabolomic data analysis.. Nucleic Acids Research. Source
Nicholson, Connelly, Lindon et al. (2002). Metabonomics: a platform for studying drug toxicity and gene function. Nature Reviews Drug Discovery. Source
References (7)
Hollywood, Brison, Goodacre (2006). Metabolomics: Current technologies and future trends. PROTEOMICS. Source
Hosack, Dennis Jr, Sherman et al. (2003). Identifying biological themes within lists of genes with EASE. Genome Biol.
References (8)
Chagoyen, Pazos (2012). Tools for the functional interpretation of metabolomic experiments. Briefings in Bioinformatics.
Barabási, Gulbahce, Loscalzo (2011). Network medicine: a network-based approach to human disease. Nature Reviews Genetics.
References (9)
Ideker, Ozier, Schwikowski et al. (2002). Discovering regulatory and signalling circuits in molecular interaction networks. Bioinformatics.
Draghici, Khatri, Tarca et al. (2007). A systems biology approach for pathway level analysis. Genome Research.
Aggio, Ruggiero, Villas-Bôas (2010). Pathway Activity Profiling (PAPi): from the metabolite profile to the metabolic pathway activity. Bioinformatics.
References (11)
Joyce, Palsson (2006). The model organism as a system: integrating’omics’ data sets. Nature Reviews Molecular Cell Biology.
Vandin, Upfal, Raphael (2011). Algorithms for detecting significantly mutated pathways in cancer. Journal of Computational Biology.
References (12)
Sugimoto, Kawakami, Robert et al. (2012). Bioinformatics tools for mass spectroscopy-based metabolomic data processing and analysis. Current Bioinformatics.